Proline Quantification in Helianthus

I’ve recently been assaying the proline content of my drought stressed sunflowers, and I have found an assay that is relatively cheap and easy. For those who don’t know, proline is an amino acid that is associated with stress tolerance and recovery in plants. It is expressed in response to many stresses, such as salinity, osmotic stress, extreme temperature, UV radiation, metal ion toxicity, pathogens, and more. Here, I outline how to get this protocol working, in case anyone is interested in checking proline content in their own plants. This assay was adopted from Ábrahám et al 2010.

This blog post will go over wet lab procedure, and result analysis in imageJ and R.
For a printable version of the wet lab procedure, see here.

Materials

Chemicals:
Isatin (small bottle opened November 2019 is in the fumehood)
Methanol
Glacial Acetic Acid
20% Ethanol
l-Proline (Must be ordered. The smallest container on Sigma Aldrich (10mg) should be enough to test ~200 samples)
Liquid Nitrogen

Other:
Chromatography Paper OR Whatman 3MM paper
Thermometer(s)
Pestle and Mortar

================================================================

Step 1: Making Isatin Chromatography Papers

This is a recipe for making about ten 8″ x 8″ chromatography papers. If you wish to make more, double the recipe. Safety notice: isatin powder is very dangerous if inhaled. Always measure out powder in the fumehood! Once dissolved, isatin is still toxic, but safe as long as gloves are worn.

1. Mix 50mL methanol and 1.75mL glacial acetic acid.

2. In the fumehood, measure out 0.5g isatin powder and add to the methanol/acetic acid, then mix until fully dissolved with a stir rod. It will take a few minutes.

3. Once all isatin is dissolved, pour into a container that is big enough to fit your papers if they are laying flat (i.e., for 8″x8″ papers, you’d want a container that is at least 8″x8″). Submerge each paper in the solution for a few seconds, then remove and let the excess drip off for a few seconds. Lay the papers out on paper towel in the fumehood to dry for about 1hr, flipping once.

4. Store papers in the dark. They are good for about two weeks.

================================================================

Step 2: Extracting Proline From Samples

I used young leaves, flash frozen after collection. It is also okay to wait a bit before flash freezing your tissues, or to collect tissues fresh and extract proline the same day without freezing first. Proline seems to be fairly stable.

To extract proline:
1. Weigh your tissue. Aim to have about 100mg of tissue for each extraction.

2. After weighing, put tissue into a mortar, then add 10uL 20% ethanol for each mg of tissue (e.g., 50mg –> 500uL ethanol, 100mg –> 1000ul ethanol, etc).

Before Grinding


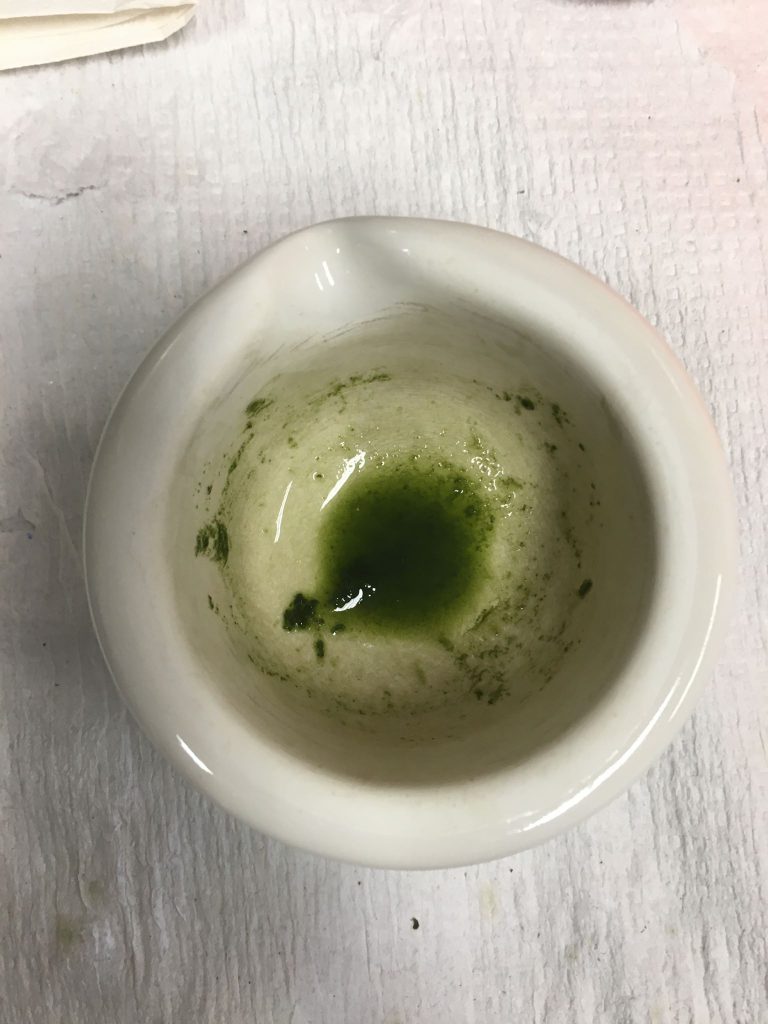
3. Grind the tissue and ethanol with the pestle for a fixed amount of time (I chose 30 seconds). After grinding, there should be some ground tissue, as well as green fluid in the bottom of the mortar. Pipette this green fluid into a 1.5mL tube.

After Grinding


4. Spin extracted fluid at 14,000rpm for 5 minutes. The supernatant of this spin contains the proline, and it is what will be used for chromatography.

================================================================

Step 3: Doing the Chromatography!

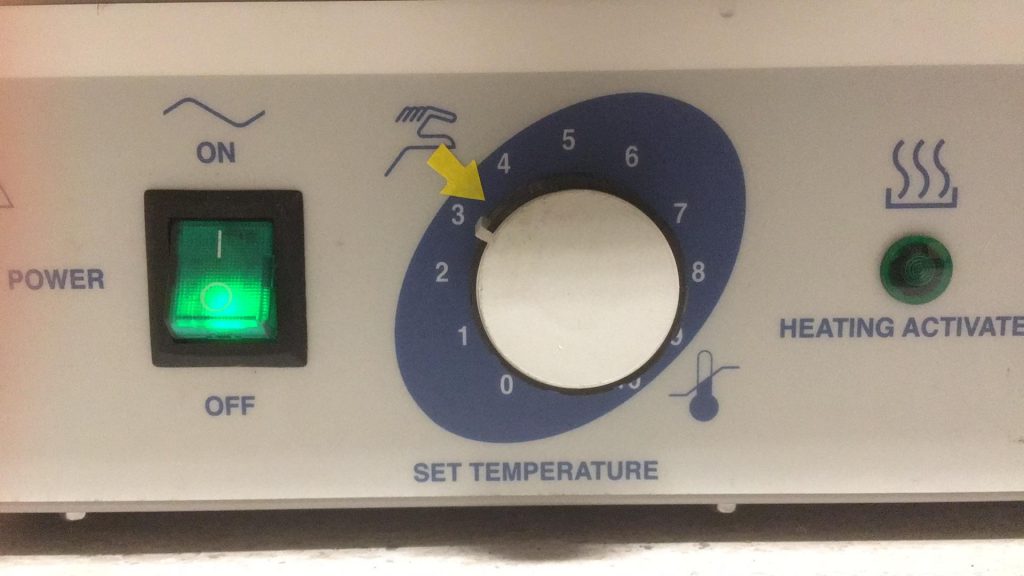
Before starting, set the left drying oven in the lab to 90ºC. The best way to do this is stick a thermometer (or two) into the oven, and set the temperature knob to line up with the yellow tape arrow between setting 3 and 4 (see below). Let the oven heat up, and check on it in about 20 minutes to make sure it’s not too hot or too cold.


1. First, make a calibration standard to compare your samples against. Use the L-proline standard ordered from sigma and add 20% ethanol to your desired concentration, then using the dissolved standard, produce a series of standards with decreasing concentration. I recommend:

5mg/mL || 1 mg/mL || 0.5mg/mL || 0.4mg/mL || 0.3mg/mL || 0.2mg/mL || 0.1mg/mL || 0.05mg/mL || 0mg/mL (20% etOH blank)

2. Pipette 10uL of each standard onto a piece of dry isatin paper, and then 10uL of each sample (the supernatant from the spin in section 2). If the sample was not just prepared, spin it again for about 3 minutes, and mix it VERY gently before blotting to limit the amount of tissue particles that get on the paper. Note: I recommend making a replicate of each standard and sample as well, if you want to use my calibration script to convert your colorimetric values into mg/mL values later.

3. Leave the paper on bench to dry 30 minutes. During the wait, check on the oven again. Adjust it to make it slightly hotter or colder if necessary. The oven is quite finicky and difficult to get to exactly 90ºC — anything between 85ºC and 95ºC seems to be good enough.

4. After 30 minutes, place the paper in the oven and wait 20 minutes.

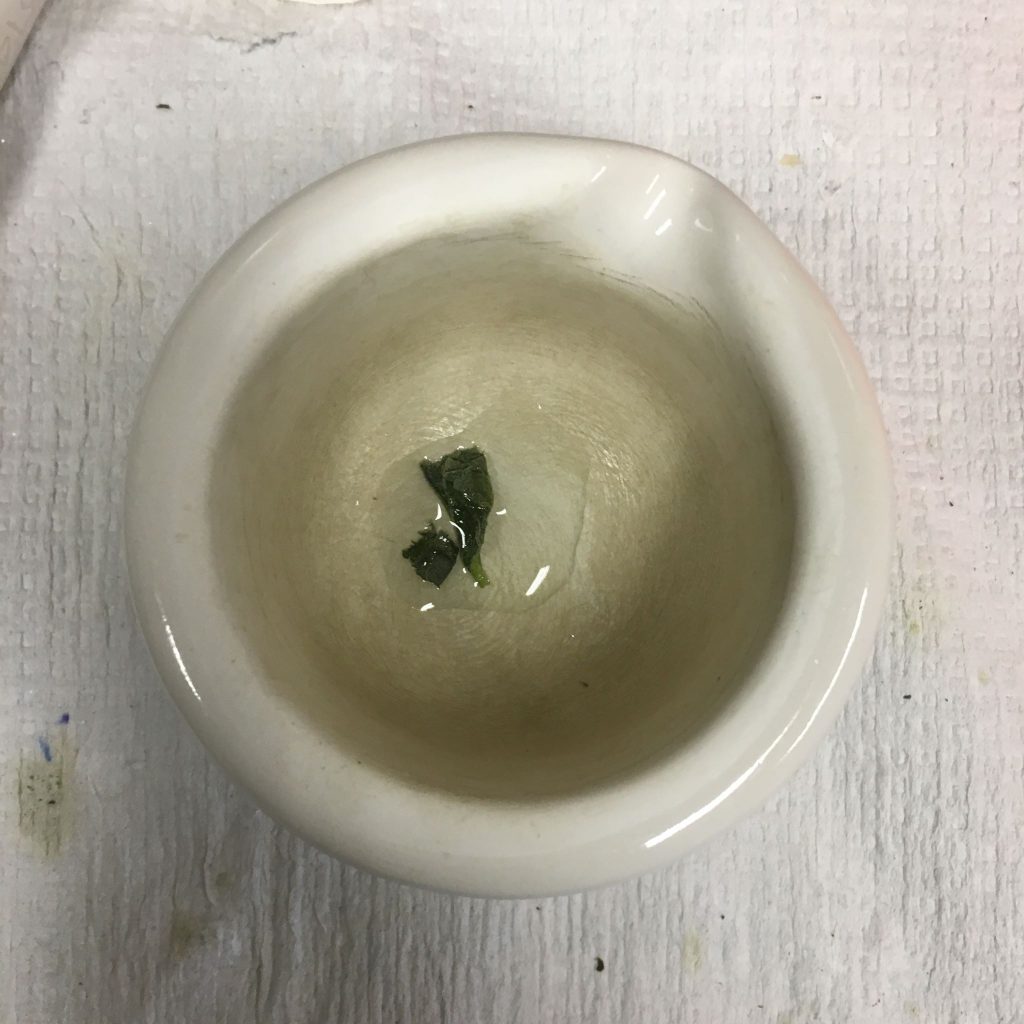
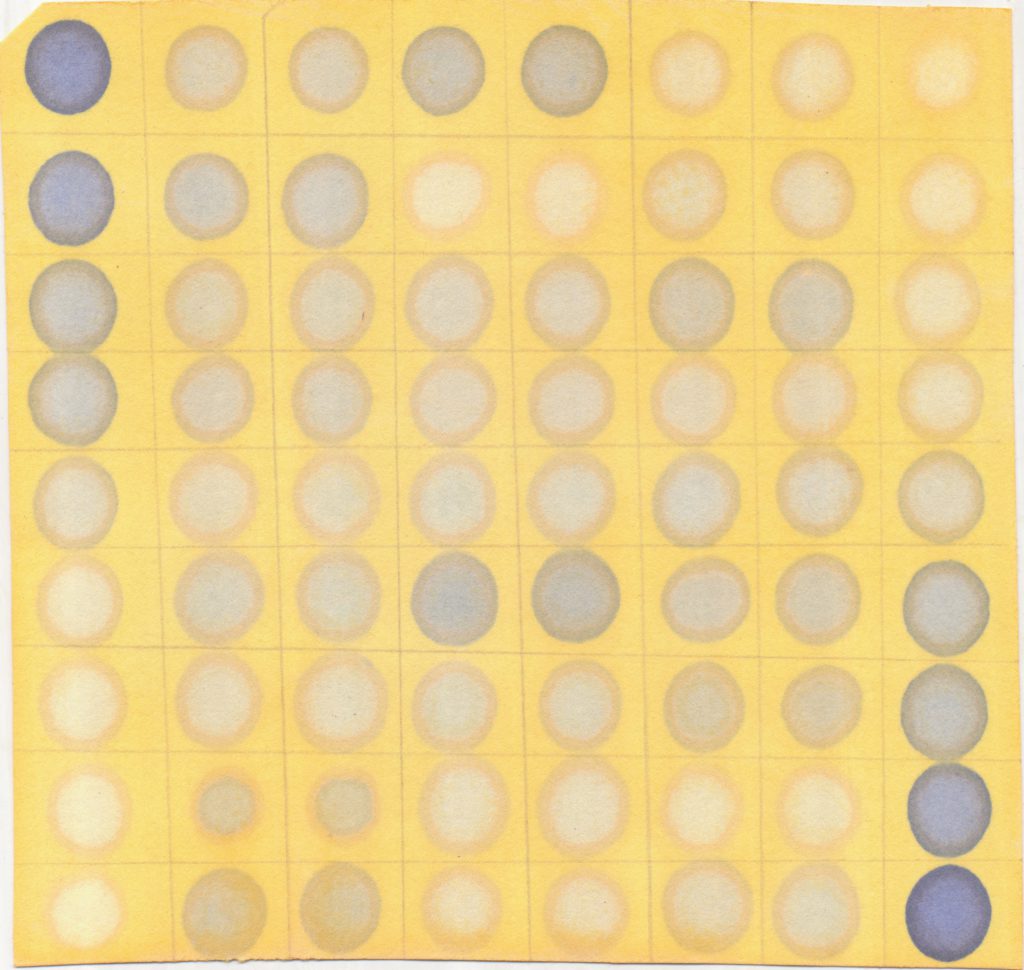
After 20 minutes, once you the paper is removed from the oven, it should look something like this (note: it seems that, at least in annuus, unstressed sunflowers don’t produce any baseline proline. If your samples are not turning blue, don’t despair):

Standards in inverse orientations on the left and righthand sides of the paper. Center contains samples. Darker blue colour indicates higher proline concentration.

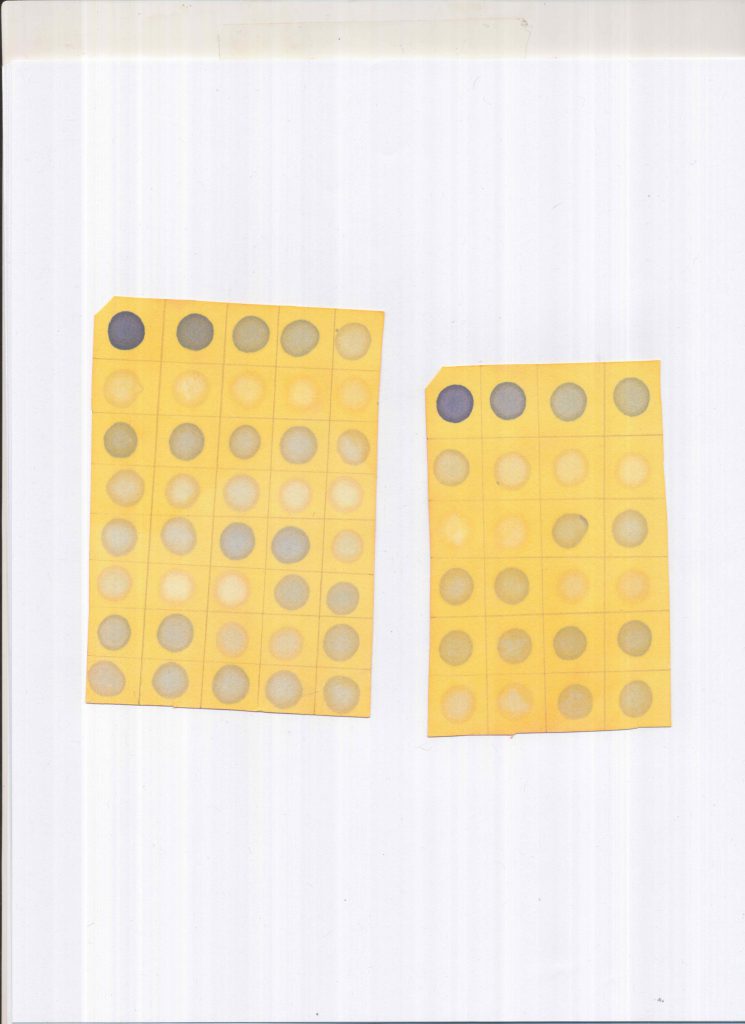
5. Scan the paper using the lab scanner. Turn on the scanner, then open MP Navigator EX. There’s a dropdown menu that asks for the document type. Select colour photo. DO NOT select colour document, as the quality of the image is very poor (see below). Save the image as a jpeg. We can now analyze the image.

Image scanned as colour photo, high quality, good resolution for analysis.
Image scanned as colour document. Poor quality, analysis would yield messy results.

================================================================

Analysis in imageJ

1. Open your scanned photo in imageJ, and in the menu bar select
Analyze > Set Measurements…

2. A menu will pop up. Uncheck everything except “Mean grey value”

3. To measure the proline content of a dot, use the oval selector tool on the dot. Limit the amount of non-dot space you select, as this can make your proline content appear falsely low.

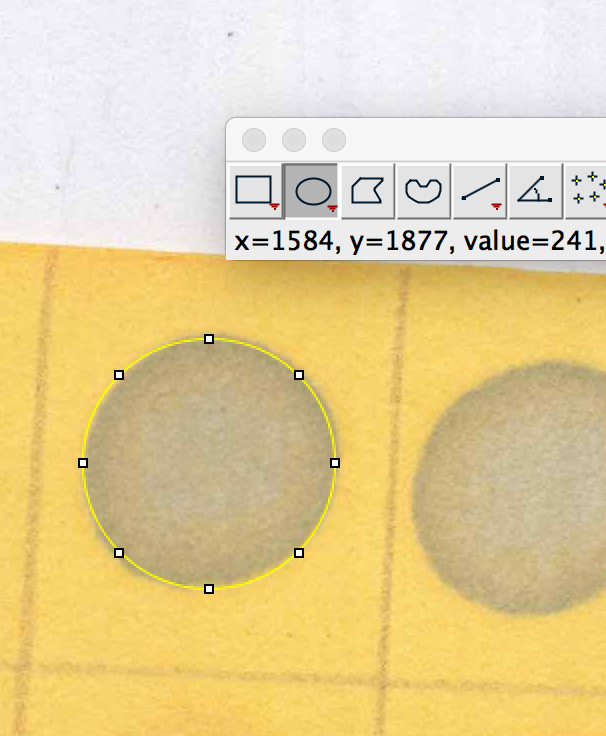
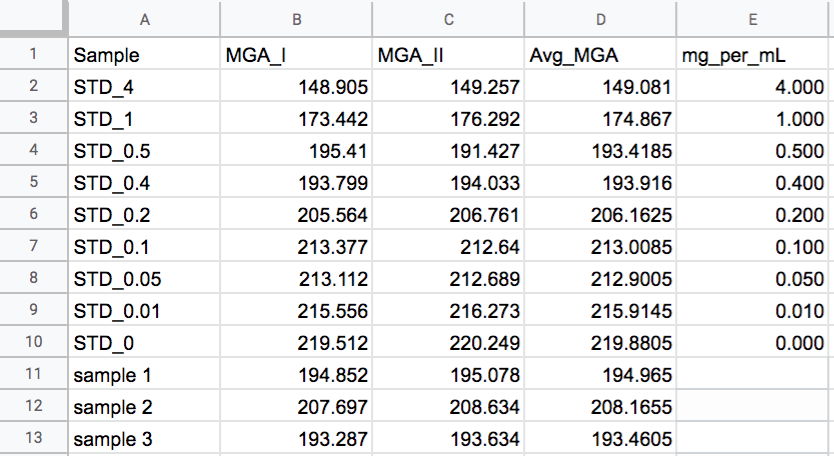
4. With the dot selected, hit ctl+m on PC, or cmd+m on mac, and a measurement window should pop up with a number. This is the mean grey area of your dot. Repeat for all dots. If you want to use my calibration script, store the data in a file with the following column headers and column order:

Fill in the mg/mL values only for the standards. The sample mg/mL will be calculated by the script.

================================================================

Calculating Sample Proline Content with a Calibration Curve in R

If your data is in the format above, you can use this script below to find the proline concentration of your samples. All that would need to be altered is lines 6-8:

[6] batchname <- “batchname” #If doing multiple batches, you can change “batchname” to something more descriptive, but this is optional
[7] batch.csv <- “data.csv” #”data.csv” is the name of your input file
[8] number_or_standards <- 9 #In my assays, I was using 9 standards. If you are using a different number, change the standard # accordingly.

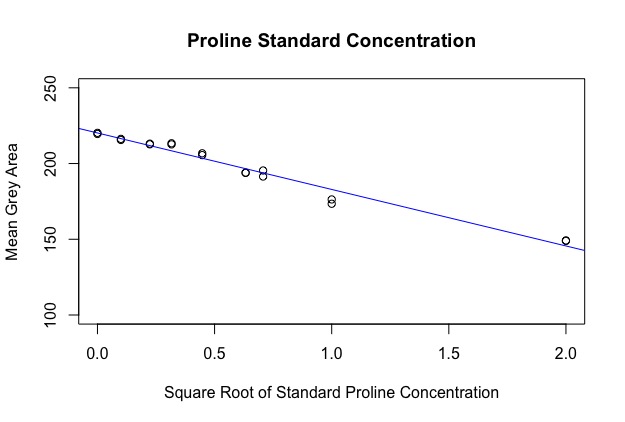
The first part of the code makes a calibration curve by plotting a regression against your standard values. Because the area of a dot was calculated, the data is quadratic, however I’ve circumvented this by taking the square root of the x-axis before running the regression. You should get an output image like this:

The next part of the code uses the regression line to find the sqrt(concentration) of each sample. See:

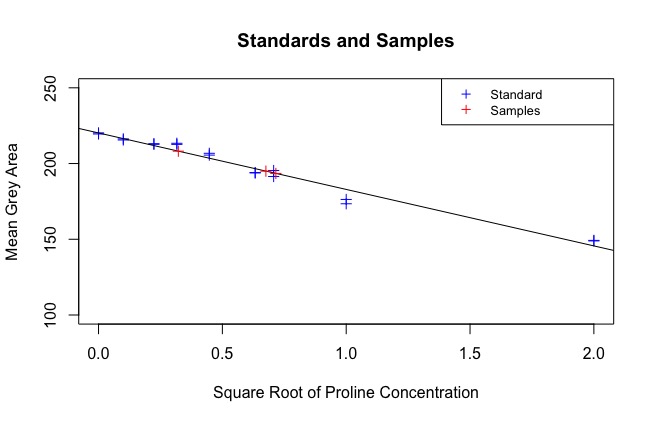
At the end of the code, a data frame called “Sample_PC” is produced that has the true concentration of each sample, calculated against the standard. These are your results:
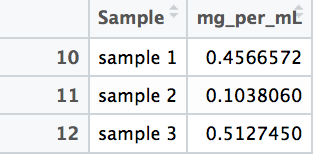
Overall Efficacy

This method can accurately predict proline concentration within 0.3mg/mL, or within 0.1mg/mL if multiple experimental replicates are performed.

Under drought stress, wild Helianthus annuus individuals seem to express anywhere between 0 and 1 mg/mL.

Better (but not perfect) HMW DNA extraction protocol

I wrote some time ago about the protocol I used to prepare HMW DNA for the new HA412 assembly. The advantage of that protocol is that it doesn’t need much tissue to start with, it’s quick and can work quite well. However, it is also quite unreliable, and will sometimes fail miserably.

To prepare HMW DNA for H. anomalus I tried a different protocol, suggested by Allen Van  Deynze at UC Davis. They used it on pepper to prepare HMW DNA for 10X linked reads (the same application I had in mind), and obtained fragments of average size ~150-200 Kb. The resulting 10X assembly was quite spectacular (N50 = 3.69 Mbp for a 3.21 Gbp genome) and was recently published. Continue reading

Even-more-diluted BigDye

It turns out that you can use half the amount of BigDye that is recommended by NAPS/SBC for Sanger sequencing and have no noticeable drop in sequence quality. The updated recipe for the working dilutions:

BigDye 3.1 stock      0.5 parts

BigDye buffer            1.5 parts

Water                       1 part

I will prepare all future working dilutions using this recipe and put them in the usual box in the common -20ºC freezer. For more details on how to prepare a sequencing reaction see this post, and for how to purify them see this or this posts.

Streamlined GBS protocol

We already have a GBS protocol on the lab blog, but since it contains three different variants (Kate’s, Brook’s and mine) it can be a bit messy to follow. Possibly because I am the only surviving member of the original trio of authors of the protocol, the approach I used seems to have become the standard in the lab, and Ivana was kind enough to distill it into a standalone protocol and add some additional notes and tips. Here it is!

Simplified GBS protocol 2017

BigDye 3.1

While cleaning up the freezer a few months back we found encrusted in a block of ice at the bottom of the common lab freezer a box with a seizable amount of BigDye 3.1, the reagent used to prepare samples for Sanger sequencing (basically a PCR mastermix with labelled nucleotides). As that is expensive stuff (what we have is worth 3-4000 dollars), I tested it to see if would still work. All the tests I did were rated “great sequence” when I got the results back from NAPS, so the BigDye is fine.

Thanks to a donation of buffer from NAPS, I have diluted some of the BigDye to the same working concentration NAPS uses (1 part of BigDye, 1.5 parts of buffer, 0.5 parts of water). Follow the instructions on the NAPS website (http://naps.msl.ubc.ca/dna-sequencing/dna-sequencing-services/user-prepared/) to prepare your sample, and use 3 µl of the diluted BigDye. There are eight aliquots of about 150 µl each (50 reactions) in a box with a yellow “BigDye” label in the common -20 ºC freezer. If you plan to do only a few reactions at a time, consider making smaller aliquots for your personal use (BigDye doesn’t like repeated freeze-thaw cycles). To avoid confusion I kept the concentrated BigDye and dilution buffer in their Applied Biosystem box on the door of the first freezer on the right in the freezer room. If we run out of dilution just let me know, and I’ll be happy to prepare more.

How to do effective SPRI beads cleaning

SPRI beads cleaning is one of the most repetitively used step during library preparations and probably the step where most of us lose a lot of precious DNAs.

Losing DNA scared me so much (because it can be observable) that I hesitated a lot before trying to use beads to concentrate genomic DNA, because usual rate of recovery are ~50%.

giphy

Hopefully with some practice and a lot of patience, it is possible to reach 90% recovery. How to lose as little DNA as possible? Here are some guidelines: Continue reading

How to do GBS libraries with “difficult” DNA samples

First of all, let’s be clear about it: Having good amount of high quality DNA should be a starting point for all projects. Recently, we had this conversation at lab meeting about the “one rule” to succeed in establishing a lab (quoting Loren): “Don’t try to save money on DNA extraction. Working with high quality DNA reduces cost at all downstream steps, even on bioinformatics”.

However, if you need to work with “historical” DNA samples from the lab (I genotyped old DNA plates at least 8 years old) or DNA from collaborator for which you have no control over the DNA quality and/or no more plant tissue to redo DNA extraction, here are some tips on how to get a maximum out of (almost) nothing.

I started the GBS protocol with 100ng of DNA, it works. However, if you want to save yourself a lot of time and the lab some money on repeating PCR, repeating samples, repeating a lot of qubit measurement, start with 200ng.

A) If some of your DNA samples are <8.5 ng/ul (100ng protocol):

Among the 1500 DNA samples I received from a collaborator, 134 did not meet the requirement (>8.5 ng/ul) to start the GBS. I thought about concentrating these DNA with different methods: 1) using beads: you need to be ready to loose 50% of the DNA; 2) speedvac: I did not find one (supposedly there is one in the Adams lab?) and I was concerned about over-concentrating TE in the same time as DNA.

Hopefully, if you look at the digestion step, a large volume of the digestion mix is water/tris. By removing this water, I was able to include in the protocol DNA with concentration >5.8ng/ul, recovering half of my problematic samples. Just be extra-careful when pipetting the 2.8 ul of “water-free” digestion master mix. I had good PCR amplification for these samples.

B) If you are desperate:

I used whole genome amplification (WGA) prior to starting the GBS protocol to increase the DNA concentration of “historical” DNA samples. You will probably recover most of your DNA samples if they are more than 1ng/ul.

However, DO NOT MIX genome amplified and plain genomic DNA on the same plate for sequencing, especially if you pool your library before doing PCR and qubiting. The WGA samples amplify much better and Sariel showed me libraries in which few WGA samples took a large part of the sequencing reads. It’s a recipe for disaster and high missing data.

My strategy was to qubit all the DNA plates and estimate the remaining volume. If the remaining DNA sample was less than 100ng, I did WGA but I moved these samples to specific WGA plates. It’s a bit more work because if your samples are already in plates, you will need to relocate all your samples. From my experience, it’s worth it.

Whole Genome Amplification

I used Whole Genome Amplification (WGA) to recover some very old DNA and include a maximum of samples into GBS plates for a mapping project. I will do another post about that, but here I would like to resume how I did the whole genome amplification.

For information on how the whole genome amplification method works, check the previous post by Moira.

I used the Qiagen Repli-g Mini Kits with the amounts divided by half.

The protocol is the following:

2.5 ul of DNA

2.5ul of buffer D1 (DLB + nuclease-free H2O)

Incubate for 3min at room temperature

Add 5ul of buffer N1 (stop solution + nuclease-free H2O)

Vortex and centrifuge

Add 15ul of master mix (repli-f reaction buffer + DNA polymerase)

Incubate at 30oC for up to 16h and inactivate enzymes at 65oC

I found that 6h was good for the amount of DNA I was hoping to recover. I recovered at least 50x the amount I started with, typically starting with concentrations between 1-10ng/ul and getting on average 60ng/ul out of the WGA protocol.

Depending on the use of the DNA, you may want to play with the incubation time (e.g. keep it short), especially if you plan to use PCR based approach later on (almost everything is PCR-based..).

Link to user manual for new, old drying ovens in the Biosci lab.

There are two new-to-the-lab drying ovens in the Biosci lab.  They appear to be older.    They do not have digital displays of the inside temperature.  Neither do they have temperature settings on the dial.  Rather, they have dedicated glass thermometers and temperature settings 1-10.  I just installed a Hobo temperature logger, set to take readings every ten minutes.  I’ll adjust the settings over the next few days to try and get a bead on what those temperature setting numbers on the outside mean.

There is a link above to the drying-oven’s manual, but it is very basic and I didn’t find it to be much help.

September 9, 2015: Follow-up

Regarding the older-model drying ovens (from Velland’s lab).

Center temp reading:

Setting 1: 26 deg. C.

Setting 2: 51 deg. C.

Setting 3: 65 deg. C.

Note, there is a marked discrepancy between readings on the glass thermometers in the oven and the Hobo temp logger upon which the above information is based.  Glass thermometers appear to read a lower temperature than the Hobo logger, up to 10 degrees difference in some cases.  The Hobo used during this trial was new and factory- calibrated.  At least one of the glass thermometers appears to have bubbles in the metering liquid, so may be faulty.

Temperature setting 2: The temp logger was in the center of an empty oven with the vent partially open during readings.  When the vent (located on the top of the unit) was opened and both shelves were filled with damp samples the top shelf appeared to run about 10 degrees cooler than the bottom shelf (according to readings from the glass thermometers).     Filled with damp samples and with the vent fully opened, average temperature for the top shelf was 33 deg. C.  And according to the glass thermometer, the temperature on the bottom shelf was about 43 degrees.  It may be worth noting that these readings were taken from glass thermometers laying directly on metal shelves, whereas the samples themselves were elevated off the metal shelves, somewhat, by their stems and sepals/calyx, and so likely insulated from any quick fluctuations by these things, as they would have been by the surrounding air and enclosing plastic bags.  At the last measurement, bottom shelf samples were warm, but not hot, to the touch.  Also, there was a vigorously living spider moving about in one of the bottom shelf bags.


Second barcode set

There is now a second set of barcoded adapters that allows higher multiplexing. They also appear to address the quality issues which have been observed in the second read of GBS runs.

This blog post has 1) Info on how to use the barcodes and where they are and 2) some data that might convince you to use them.

Usage

These add a second barcode to the start of the second read before the MSP RE site. The first bases of the second read contain the barcode, just like with the first read. Marco T. designed and ordered these and the info needed to order them is here: https://docs.google.com/spreadsheets/d/1ZXuHKfaR1BYPBX6g0p9GdZHp_21A3z_9pPt_aW0amwM/edit?usp=sharing

I’ve labeled them MTC1-12 and the barcode sequences are as follows.

MTC1 AACT
MTC2 CCAG
MTC3 TTGA
MTC4 GGTCA
MTC5 AACAT
MTC6 CCACG
MTC7 CTTGTA
MTC8 TCGTAT
MTC9 GGACGT
MTC10 AACAGAT
MTC11 CTTGTTA
MTC12 TCGTAAT

They are used in place of the common adapter in the standard protocol (1ul/sample). One possible use, and simplest to use as an example, would be to use these to run 12 plates in a lane. In this case you would make a master mix for the ligation of each plate which contains a different MTC adapter.

Where are they? In the -20 at the back left corner of the bay on the bottom shelf in a box that has a pink lab tape label that says something to the extent of “barcodes + barcoded adapters 1-12”. This contains the working concentration for each of the MTC adapters. Beside that is a box containing the unannealed and as ordered oligos and the annealed stock. The information regarding what I did and what is in the box is written there. The stock needs an additional 1/20 dilution to get to the working concentration

How it looks

First, the quality of the second read is just about as nice as the first read. Using fastqc to look at 4million reads of some random run:

Read one:
R1_fastqc_quality

Read two:
R2_fastqc_report

Now, for the slightly more idiosyncratic part: read counts. In short I dont see any obvious issue with any of these barcodes. I did 5 sets of 5 plates/lane. For all the plates I used the 97-192 bacodes for the Pst side. Then each plate got a differnt MTC barcode for the MSP side. Following the PCR I pooled all of the samples from the plate and quantified. Each plate had a different number of samples which I took into account during the pooling step. Here is the read counts from a randomly selected 4 million reads corrected to number of samples in that plate. Like I said it is a little idiosyncratic but the take home is that they are about as even as you might expect given usual in accuracies in the lab, my hands, and the fact that this is a relatively small sample.

Lane 1
MTC5	14464
MTC1	13518
MTC7	14463
MTC9	13448
MTC3	14232

Lane 2	
MTC10	30395
MTC6	11267
MTC2	8263
MTC4	19295
MTC8	14766

Lane 3	
MTC5	16631
MTC7	17315
MTC11	11623
MTC9	16256
MTC3	13831

Lane 4		
MTC10	11302
MTC6	12120
MTC4	10326
MTC12	18959
MTC8	12832
	
Lane 5
MTC1	13151
MTC6	13490
MTC2	12851
MTC11	12460
MTC12	17296

DSN depletion for GBS libraries

This step is mentioned in our current GBS protocol, but I forgot to upload it until now. It’s basically the same as the WGS one, with minor changes. I am attaching a couple of bioanalyzer plots of the same library before and after DSN treatment. The sharp peaks/thick bands disappearing after the DSN treatment are likely chloroplast fragments.

Continue reading

Battle of the lids!

Everyone know the foil lids are the undisputed lab champs for normal use and storage. What many people don’t know is that they are more than $2 each! Also, sometimes we can be out and they can be on backorder. Luckily, we have more than 1000 other lids on hand. The problem is that some have bad reputations. Lets find out if they are earned or not!

TLDR: Use Fisherbrand, seal with 75C lid temp.

Continue reading

Home-brew WGS library multiplexing

There are two main ways to barcode WGS libraries so that they can be run together on a same lane:

– In-line barcodes: unique sequences are located at the very end of one or both adapters. This sequence will be at the very beginning of each read from a given library. This is the barcode system that is normally used fro GBS libraries as well.

– Indices: barcodes are in the middle of one or both adapters. These barcodes are read through an independent round of sequencing. For a paired-end library you would have therefore two rounds of sequencing of your fragment and a third round of sequencing for the index (and I guess a fourth one as well, if you have double indices). This is the system used in most commercial kits.

Continue reading

PstI-MspI GBS protocol

The “protocol” that we have been using is available here as a Google doc. I use quotes there because, as you will see, there is no single protocol used by the lab to date. Without analyzed sequence data yet to compare the described protocols, the best advice I can give to you is to pick a sensible pipeline for your needs, taking into consideration the time/effort/desired output that works for you, and apply that pipeline consistently to all samples for the same project. All sets of methods described have resulted in libraries that pass QC and generate a sufficient reads during sequencing. Good luck!

GBS barcodes 1-96 stocks

In the freezer there is a deep well plate with annealed barcodes 1-96, labelled plate 1C. Recently Dan Bock and myself used it to make stock concentration plates. Plate 1C has been qubit three times, here is an excel spreadsheet with the concentrations. They are in chronological order (i.e. Dan’s measurements are the most recent). I’ve also included an average column.

qubit-1-96GBS

So if you need to make your own plates for barcodes 1-96, you can use this. Dan Bock recommends diluting to a 4X concentration, qubiting that plate, then using that to dilute to 1X concentration if you want to be more accurate.