Using LyX to format a thesis for UBC

I used LyX to format my thesis. I started using a set of files made available at the FOGS website. LyX is a “what you see is what you want” interface for Latex. Overall, I had a good experience using this program. There was only one formatting problem in the LyX files online which is now corrected. Other than that I the only things I had to address were errors of my own (too many words in the abstract for example). For sharing, I found it came out looking the nicest to export an HTML file, open it in a browser and then copy pasting it into word. This is a little tedious but I found it was an acceptable trade off given 1) the ease of use 2) how pretty it turned out and 3) the fact that word would have a complete meltdown with this many figures/tables/references. There are plugins for LyX which should allow more direct exporting.

Please let me know if you are able, or unable to use this. If you find and fix bugs please share!

Minimal_Functional_UBC_LyXThesis

Protip: put this folder in dropbox. Use relative paths to all of you figures (which you have put in the figures folder) as I have done in the example. This way you will should be able to generate the pdf from any computer with LyX and dropbox.


Link to user manual for new, old drying ovens in the Biosci lab.

There are two new-to-the-lab drying ovens in the Biosci lab.  They appear to be older.    They do not have digital displays of the inside temperature.  Neither do they have temperature settings on the dial.  Rather, they have dedicated glass thermometers and temperature settings 1-10.  I just installed a Hobo temperature logger, set to take readings every ten minutes.  I’ll adjust the settings over the next few days to try and get a bead on what those temperature setting numbers on the outside mean.

There is a link above to the drying-oven’s manual, but it is very basic and I didn’t find it to be much help.

September 9, 2015: Follow-up

Regarding the older-model drying ovens (from Velland’s lab).

Center temp reading:

Setting 1: 26 deg. C.

Setting 2: 51 deg. C.

Setting 3: 65 deg. C.

Note, there is a marked discrepancy between readings on the glass thermometers in the oven and the Hobo temp logger upon which the above information is based.  Glass thermometers appear to read a lower temperature than the Hobo logger, up to 10 degrees difference in some cases.  The Hobo used during this trial was new and factory- calibrated.  At least one of the glass thermometers appears to have bubbles in the metering liquid, so may be faulty.

Temperature setting 2: The temp logger was in the center of an empty oven with the vent partially open during readings.  When the vent (located on the top of the unit) was opened and both shelves were filled with damp samples the top shelf appeared to run about 10 degrees cooler than the bottom shelf (according to readings from the glass thermometers).     Filled with damp samples and with the vent fully opened, average temperature for the top shelf was 33 deg. C.  And according to the glass thermometer, the temperature on the bottom shelf was about 43 degrees.  It may be worth noting that these readings were taken from glass thermometers laying directly on metal shelves, whereas the samples themselves were elevated off the metal shelves, somewhat, by their stems and sepals/calyx, and so likely insulated from any quick fluctuations by these things, as they would have been by the surrounding air and enclosing plastic bags.  At the last measurement, bottom shelf samples were warm, but not hot, to the touch.  Also, there was a vigorously living spider moving about in one of the bottom shelf bags.


How to use FTP (good for uploading data to the SRA)

So you have done everything described in my earlier post about uploading data to the SRA and have received ftp instructions. It is pretty straight forward if you have experience in bash/shell. First navigate into the directory all of your data is in. They type:

 ftp ftp-private.ncbi.nlm.nih.gov

Or whatever you target site is. You will be prompted to enter the supplied username and password. From here, the unix commands ‘cd’ ‘ls’ and ‘mkdir’ all work just as on our other machines. You can make a new directory for your data or just dump it where you are (there are no instructions otherwise). To upload one file use ‘put’.

 put Myfile1.txt

To a bunch, you should first turn off the prompt and then use mput with a wild card.

 
prompt
mput MyFile*txt

Check it is all there with ls and leave.

exit

Bibtex library

Even the smartest reference software needs some hand editing help. Here is the bibtex file I used for my thesis. At least the ~200 papers I cite in my thesis are correct. It could be a useful starting point for anyone using a reference manager. The best way to add papers is to find it in google scholar, click cite, click bibtext. Then copy and paste it into this file which you have opened in a plain text editor.

Here it is (you may need to remove the .txt):

GB_Bibtex_ReferenceLibrary.bib

Second barcode set

There is now a second set of barcoded adapters that allows higher multiplexing. They also appear to address the quality issues which have been observed in the second read of GBS runs.

This blog post has 1) Info on how to use the barcodes and where they are and 2) some data that might convince you to use them.

Usage

These add a second barcode to the start of the second read before the MSP RE site. The first bases of the second read contain the barcode, just like with the first read. Marco T. designed and ordered these and the info needed to order them is here: https://docs.google.com/spreadsheets/d/1ZXuHKfaR1BYPBX6g0p9GdZHp_21A3z_9pPt_aW0amwM/edit?usp=sharing

I’ve labeled them MTC1-12 and the barcode sequences are as follows.

MTC1 AACT
MTC2 CCAG
MTC3 TTGA
MTC4 GGTCA
MTC5 AACAT
MTC6 CCACG
MTC7 CTTGTA
MTC8 TCGTAT
MTC9 GGACGT
MTC10 AACAGAT
MTC11 CTTGTTA
MTC12 TCGTAAT

They are used in place of the common adapter in the standard protocol (1ul/sample). One possible use, and simplest to use as an example, would be to use these to run 12 plates in a lane. In this case you would make a master mix for the ligation of each plate which contains a different MTC adapter.

Where are they? In the -20 at the back left corner of the bay on the bottom shelf in a box that has a pink lab tape label that says something to the extent of “barcodes + barcoded adapters 1-12”. This contains the working concentration for each of the MTC adapters. Beside that is a box containing the unannealed and as ordered oligos and the annealed stock. The information regarding what I did and what is in the box is written there. The stock needs an additional 1/20 dilution to get to the working concentration

How it looks

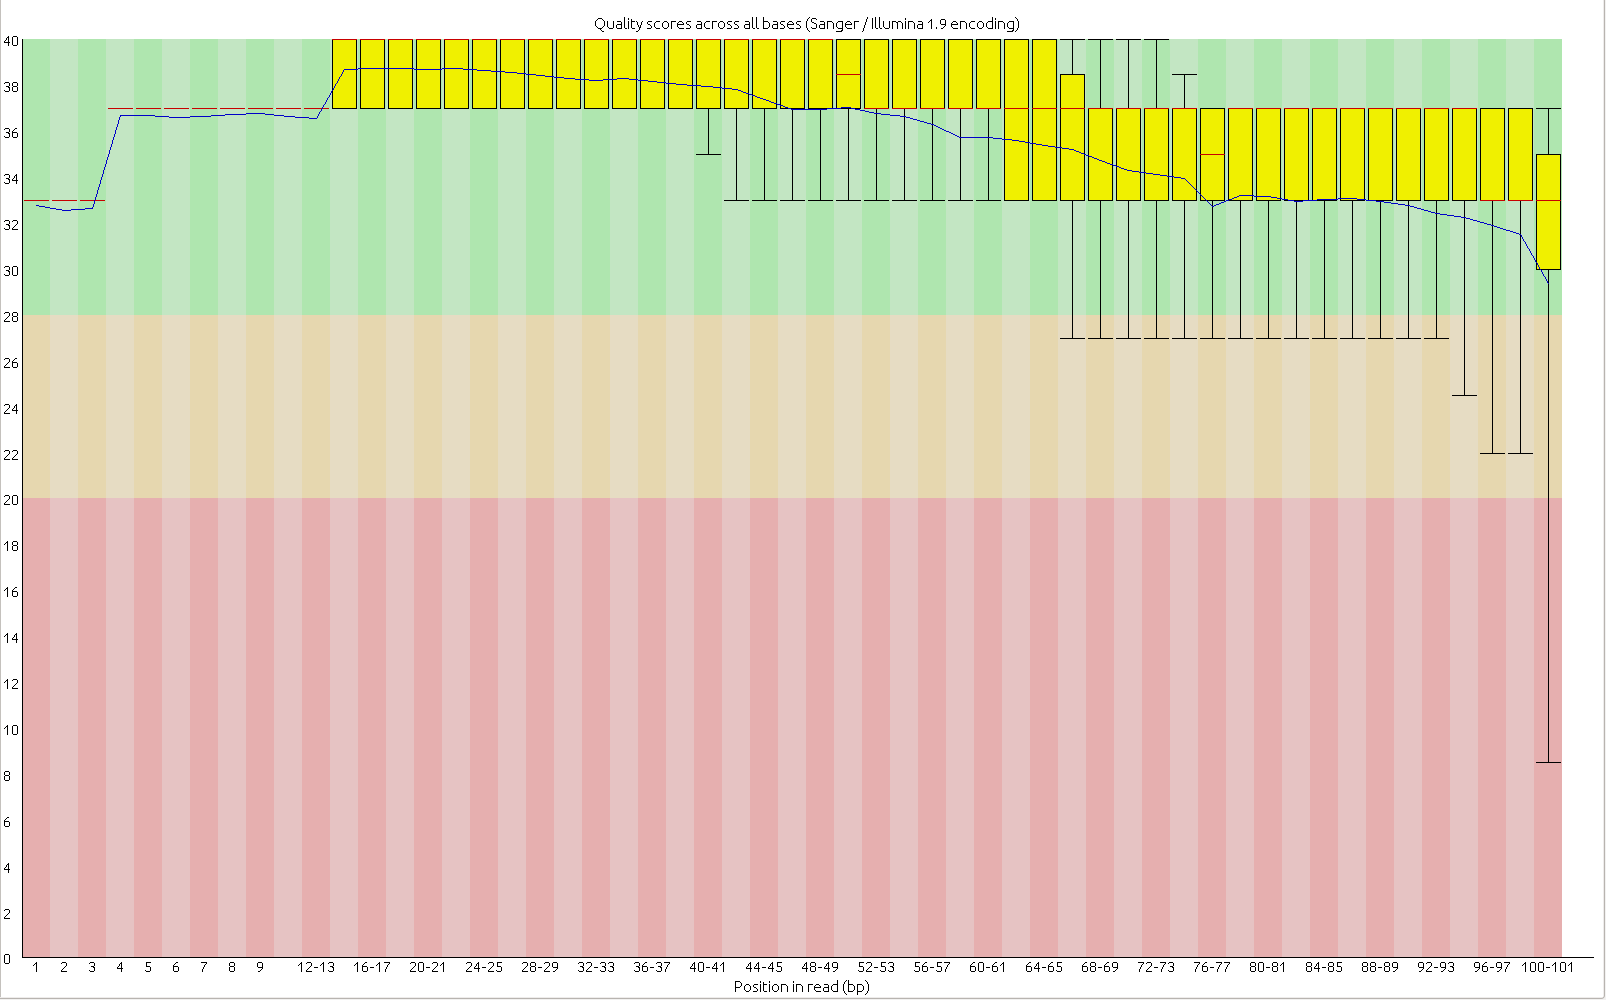
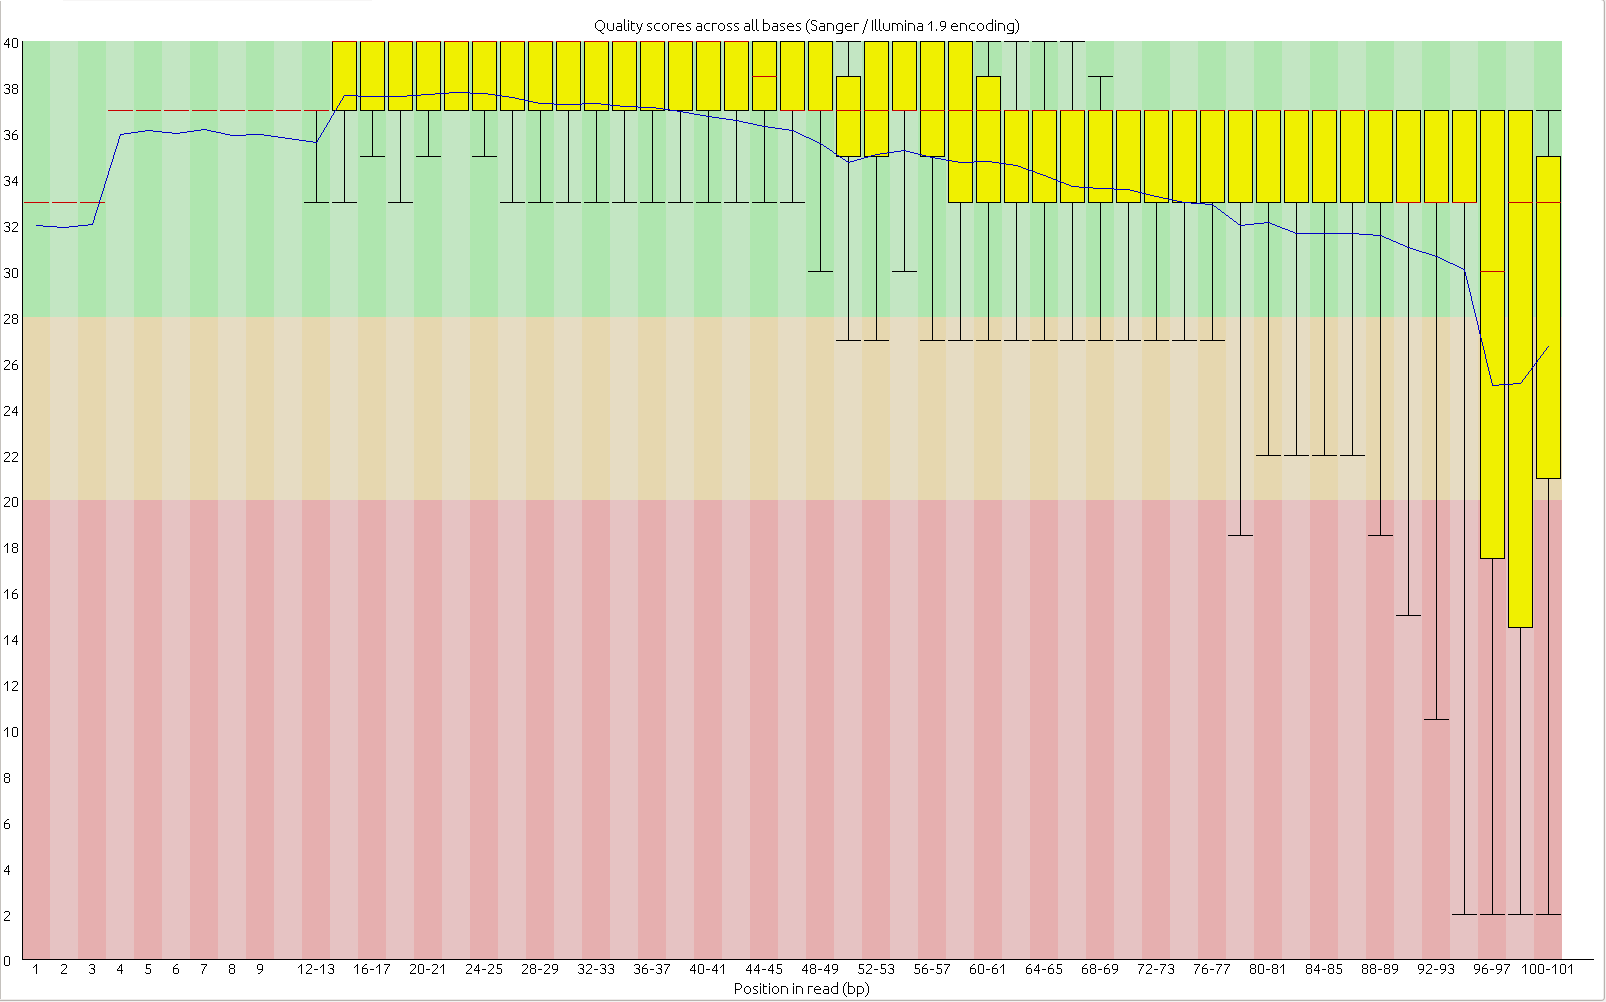
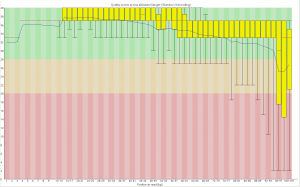
First, the quality of the second read is just about as nice as the first read. Using fastqc to look at 4million reads of some random run:

Read one:
R1_fastqc_quality

Read two:
R2_fastqc_report

Now, for the slightly more idiosyncratic part: read counts. In short I dont see any obvious issue with any of these barcodes. I did 5 sets of 5 plates/lane. For all the plates I used the 97-192 bacodes for the Pst side. Then each plate got a differnt MTC barcode for the MSP side. Following the PCR I pooled all of the samples from the plate and quantified. Each plate had a different number of samples which I took into account during the pooling step. Here is the read counts from a randomly selected 4 million reads corrected to number of samples in that plate. Like I said it is a little idiosyncratic but the take home is that they are about as even as you might expect given usual in accuracies in the lab, my hands, and the fact that this is a relatively small sample.

Lane 1
MTC5	14464
MTC1	13518
MTC7	14463
MTC9	13448
MTC3	14232

Lane 2	
MTC10	30395
MTC6	11267
MTC2	8263
MTC4	19295
MTC8	14766

Lane 3	
MTC5	16631
MTC7	17315
MTC11	11623
MTC9	16256
MTC3	13831

Lane 4		
MTC10	11302
MTC6	12120
MTC4	10326
MTC12	18959
MTC8	12832
	
Lane 5
MTC1	13151
MTC6	13490
MTC2	12851
MTC11	12460
MTC12	17296

Splits tree and iupac coding

I’ve been running splitstree to see the relationships between samples of H. bolanderi. I have coded my data using IUPAC so hets are a different symbol (Y, W, etc). The other way to code heterozygous sites into fasta is just pick one allele randomly.

By default, splitstree ignores all ambiguous sites, so if you use IUPAC coding, it will ignore all those sites. I switched it from ignoring, to using an average for all possible alleles. This made my tree much messier and had a weird smattering of samples pulled toward the outgroup. I’ve figured out that it has to do with the amount of missing data. Since Ns are ambiguous, when you average N it just sort of homogenizes the distances between samples. Thus, it can pull your samples into weird positions if they have different amounts of missing data.

My thoughts are that you should just ignore ambiguous data if you have enough sites to resolve your samples without them.

Sample Information Table

There is a constant problem of record keeping in the lab, and it is the most annoying in regards to sequence data. We have lots of data but finding out exactly what plants the data came from is difficult. So, I’m taking the old sample information table Seb made years ago and making it mandatory.

You must fill out this form before you get access to your sequence data. There will be one row per sample, meaning that for a GBS library you will have 96 or 192 rows.

Sample information table

Need cM positions?

Hello,

For a lot of work, it is helpful to know the cM position of your snps. Here is a script that takes the linkage map produced by Chris, your snp table in Hapmap format, and adds a column giving you a cM position for each site. It interpolates between known positions, so individual positions the accuracy of the position is overstated, but it’s good for plotting.

https://github.com/owensgl/reformat/blob/master/hmp2cmpositions.pl

usage:

perl hmp2cmpositions.pl /moonriseNFS/HA412/pseudomolecules/lg.ALL.bronze14.path.txt yoursnptable.hmp > yoursnptable.withcm.hmp


DSN depletion for GBS libraries

This step is mentioned in our current GBS protocol, but I forgot to upload it until now. It’s basically the same as the WGS one, with minor changes. I am attaching a couple of bioanalyzer plots of the same library before and after DSN treatment. The sharp peaks/thick bands disappearing after the DSN treatment are likely chloroplast fragments.

Continue reading

Blog comments closed!? Short term fix

Featured

For some reason, caused by either WordPress or an associated plugin, comment sections are closed for all the current and new posts, as far as I can tell. The ultimate solution may require a bit of work. But for the moment, if you write a post or want to comment on a post, do this to turn on the comments:

  1. Log in.
  2. Go to the RLR blog dashboard (dial icon, top left of screen).
  3. Click on Posts/All Posts on left-side panel.
  4. Find the slug of the post you are interested in. Click the “Quick Edit” link under the post’s title.
  5. Click the box “Allow comments”. Comments should now be turned on, go to post and comment at will.

If anyone feels inclined to come up with a universal or permanent solution, this might be a place to start.

Battle of the lids!

Everyone know the foil lids are the undisputed lab champs for normal use and storage. What many people don’t know is that they are more than $2 each! Also, sometimes we can be out and they can be on backorder. Luckily, we have more than 1000 other lids on hand. The problem is that some have bad reputations. Lets find out if they are earned or not!

TLDR: Use Fisherbrand, seal with 75C lid temp.

Continue reading

SmartGit GUI Tool

NOTE: This is an old draft post from Thuy (last updated 17 Dec 2012). I’m publishing it because it seems useful and mainly complete. –Brook

What is Git?

Git is a distributed source control version system.  It allows multiple people to work on the same code simultaneously by keeping track of changes made to files.  It visualizes differences between file versions and merges changes from different authors.  It also makes snapshots of file versions, so that you can go back to any version later.  Because git is distributed, you store a copy of the code repository and its change history on your own local machine.  When you are ready, you can sync your files to a remote repository server, such as BitBucket or GitHub.  Syncing to the remote server will share the updated code with all the other users, and they can merge the changes into their own copies if they wish.  Whether or not you use a remote repository server, git will always store your entire repository change history on your local machine.

Continue reading

Phred score detector

When using old sequence data you have to know what phred score system it is using. Almost all new data is going to use Phred33, but the old stuff could also be Phred64. There are scripts on this website that have ways of automatically detecting it http://wiki.bits.vib.be/index.php/Identify_the_Phred_scale_of_quality_scores_used_in_fastQ

I took the perl script from this website and parred down the output so that it works in pipelines. It outputs either “phred33” or “phred64”

fastq_detect_minimal.pl

An example pipeline in bash is:

coding=”$(perl $bin/fastq_detect_minimal.pl ${name}_1.fq)”

java -jar trimmmomatic-0.32.jar -$coding sample1.fq ….etc

NOTE: Phred64 should only go up to 104. There are some RNA seq samples (and probably others) that go up to 105. The original script output an error, while my version just says phred64. I hope that running it through phred conversion in trimmomatic fixes the issue but I am not sure.

Home-brew WGS library multiplexing

There are two main ways to barcode WGS libraries so that they can be run together on a same lane:

– In-line barcodes: unique sequences are located at the very end of one or both adapters. This sequence will be at the very beginning of each read from a given library. This is the barcode system that is normally used fro GBS libraries as well.

– Indices: barcodes are in the middle of one or both adapters. These barcodes are read through an independent round of sequencing. For a paired-end library you would have therefore two rounds of sequencing of your fragment and a third round of sequencing for the index (and I guess a fourth one as well, if you have double indices). This is the system used in most commercial kits.

Continue reading

2 enzyme GBS UNEAK trickery

Want to run UNEAK on a bunch of samples that you sequenced using 2 enzyme GBS? You came to the right place!

This takes R1.fastq.gz and R2.fastq.gz files and makes a single file containing both reads with the appropriate barcodes put on read 2 and the CGG RE site changed to the Pst sequence. This lets you use all of your data in UNEAK… well at least the first 64 bases of all your data!

This also deals with the fact that we get data that is from one lane but split into many files. See example LaneInfo file*. You will also need an appropriately formatted UNEAK key file.

*Only list READ1 in this file. It will only work if your files are named /dir/dir/dir/ABC_R1.fastq.gz and /dir/dir/dir/ABC_R2.fastq.gz.

so the file would read:
/dir/dir/dir/ ABC_R1.fastq C5CDUACXX 3

This is also made to work with .gz fastq files.

usage:
greg@computer$ perl bin/MultiLane_UneakTricker.pl design/UNEAK_KEY_FILE design/LaneInfo.txt /home/greg/project/UNEAK/Illumina

You must have the GBS_Fastq_BarcodeAdder_2Enzyme.pl* in the same bin folder. You also need to make a “tmp” folder.

LaneInfo
MultiLane_UneakTricker_v2
GBS_Fastq_BarcodeAdder_2Enzyme_v2

protip: UNEAK will be fooled by soft links so you can use them instead of copying your data.

Percent reads aligned collector

When you publish next gen sequencing data you have to include the percent reads aligned. The number is easy to get but when you have 200+ samples it’s a pain to collate them together. This script takes a directory with bam files, uses samtools flagstat to get percent reads aligned and then does a little rejiggering of format to put it in a nice list. To run it, enter the directory with the bams and type ‘bash ./percent_counter.bash’

percent_counter.bash NOTE: The script is gzipped.

PstI-MspI GBS protocol

The “protocol” that we have been using is available here as a Google doc. I use quotes there because, as you will see, there is no single protocol used by the lab to date. Without analyzed sequence data yet to compare the described protocols, the best advice I can give to you is to pick a sensible pipeline for your needs, taking into consideration the time/effort/desired output that works for you, and apply that pipeline consistently to all samples for the same project. All sets of methods described have resulted in libraries that pass QC and generate a sufficient reads during sequencing. Good luck!

GBS barcodes 1-96 stocks

In the freezer there is a deep well plate with annealed barcodes 1-96, labelled plate 1C. Recently Dan Bock and myself used it to make stock concentration plates. Plate 1C has been qubit three times, here is an excel spreadsheet with the concentrations. They are in chronological order (i.e. Dan’s measurements are the most recent). I’ve also included an average column.

qubit-1-96GBS

So if you need to make your own plates for barcodes 1-96, you can use this. Dan Bock recommends diluting to a 4X concentration, qubiting that plate, then using that to dilute to 1X concentration if you want to be more accurate.