Tag Archives: hypothesis testing

On Defining a Statistical Population

The more I do “field ecology” the more I wonder about our standard statistical advice to young ecologists to “random sample your statistical population”. Go to the literature and look for papers on “random environmental fluctuations”, or “non-random processes”, or “random mating” and you will be overwhelmed with references and biology’s preoccupation with randomness. Perhaps we should start with the opposite paradigm, that nothing in the biological world is random in space or time, and then the corollary that if your data show a random pattern or random mating or whatever random, it means you have not done enough research and your inferences are weak.

Since virtually all modern statistical inference rests on a foundation of random sampling, every statistician will be outraged by any concerns that random sampling is possible only in situations that are scientifically uninteresting. It is nearly impossible to find an ecological paper about anything in the real world that even mentions what their statistical “population” is, what they are trying to draw inferences about. And there is a very good reason for this – it is quite impossible to define any statistical population except for those of trivial interest. Suppose we wish to measure the heights of the male 12-year-olds that go to school in Minneapolis in 2017. You can certainly do this, and select a random sample, as all statisticians would recommend. And if you continued to do this for 50 years, you would have a lot of data but no understanding of any growth changes in 12-year-old male humans because the children of 2067 in Minneapolis would be different in many ways from those of today. And so, it is like the daily report of the stock market, lots of numbers with no understanding of processes.

Despite all these ‘philosophical’ issues, ecologists carry on and try to get around this by sampling a small area that is considered homogeneous (to the human eye at least) and then arm waving that their conclusions will apply across the world for similar small areas of some ill-defined habitat (Krebs 2010). Climate change may of course disrupt our conclusions, but perhaps this is all we can do.

Alternatively, we can retreat to the minimalist position and argue that we are drawing no general conclusions but only describing the state of this small piece of real estate in 2017. But alas this is not what science is supposed to be about. We are supposed to reach general conclusions and even general laws with some predictive power. Should biologists just give up pretending they are scientists? That would not be good for our image, but on the other hand to say that the laws of ecology have changed because the climate is changing is not comforting to our political masters. Imagine the outcry if the laws of physics changed over time, so that for example in 25years it might be that CO2 is not a greenhouse gas. Impossible.

These considerations should make ecologists and other biologists very humble, but in fact this cannot be because the media would not approve and money for research would never flow into biology. Humility is a lost virtue in many western cultures, and particularly in ecology we leap from bandwagon to bandwagon to avoid the judgement that our research is limited in application to undefined statistical populations.

One solution to the dilemma of the impossibility of random sampling is just to ignore this requirement, and this approach seems to be the most common solution implicit in ecology papers. Rabe et al. (2002) surveyed the methods used by management agencies to survey population of large mammals and found that even when it was possible to use randomized counts on survey areas, most states used non-random sampling which leads to possible bias in estimates even in aerial surveys. They pointed out that ground surveys of big game were even more likely to provide data based on non-random sampling simply because most of the survey area is very difficult to access on foot. The general problem is that inference is limited in all these wildlife surveys and we do not know the ‘population’ to which the numbers derived are applicable.

In an interesting paper that could apply directly to ecology papers, Williamson (2003) analyzed research papers in a nursing journal to ask if random sampling was utilized in contrast to convenience sampling. He found that only 32% of the 89 studies he reviewed used random sampling. I suspect that this kind of result would apply to much of medical research now, and it might be useful to repeat his kind of analysis with a current ecology journal. He did not consider the even more difficult issue of exactly what statistical population is specified in particular medical studies.

I would recommend that you should put a red flag up when you read “random” in an ecology paper and try to determine how exactly the term is used. But carry on with your research because:

Errors using inadequate data are much less than those using no data at all.

Charles Babbage (1792–1871

Krebs CJ (2010). Case studies and ecological understanding. Chapter 13 in: Billick I, Price MV, eds. The Ecology of Place: Contributions of Place-Based Research to Ecological Understanding. University of Chicago Press, Chicago, pp. 283-302. ISBN: 9780226050430

Rabe, M. J., Rosenstock, S. S. & deVos, J. C. (2002) Review of big-game survey methods used by wildlife agencies of the western United States. Wildlife Society Bulletin, 30, 46-52.

Williamson, G. R. (2003) Misrepresenting random sampling? A systematic review of research papers in the Journal of Advanced Nursing. Journal of Advanced Nursing, 44, 278-288. doi: 10.1046/j.1365-2648.2003.02803.x
 

On Ecological Predictions

The gold standard of ecological studies is the understanding of a particular ecological issue or system and the ability to predict the operation of that system in the future. A simple example is the masting of trees (Pearse et al. 2016). Mast seeding is synchronous and highly variable seed production among years by a population of perennial plants. One ecological question is what environmental drivers cause these masting years and what factors can be used to predict mast years. Weather cues and plant resource states presumably interact to determine mast years. The question I wish to raise here, given this widely observed natural history event, is how good our predictive models can be on a spatial and temporal scale.

On a spatial scale masting events can be widespread or localized, and this provides some cues to the important weather variables that might be important. Assuming we can derive weather models for prediction, we face two often unknown constraints – space and time. If we can derive a weather model for trees in New Zealand, will it also apply to trees in Australia or California? Or on a more constrained geographical view, if it applied on the South Island of New Zealand will it also apply on the North Island? At the other extreme, must we derive models for every population of particular plants in different areas, so that predictability is spatially limited? We hope not and work on the assumption of more spatial generality than what we can measure on our particular small study areas.

The temporal stability of our explanations is now particularly worrisome because of climate change. If we have a good model of masting for a particular tree species in 2017, will it still be working in 2030, 2050 or 2100? A physicist would never ask such a question since a “scientific law” is independent of time. But biology in general and ecology in particular is not time independent both because of evolution and now in particular because of changing climate. But we have not faced up to whether or not we must check our “ecological laws” over and over again as the environment changes, and if we have to do this what must the time scale of rechecking be? Perhaps this question can be answered by determining the speed of potential evolutionary change in species groups. If virus diseases can evolve quickly in terms of months or years, we must be eternally vigilant to consider if the flu virus of 2017 is going to be the same as that of 2016. We should not stop virus research and say that we have sorted out some universal model that will become an equivalent of the laws of physics.

The consequences of these simple observations are not simple. One consequence is the implication that monitoring is an essential ecological activity. But in most ecological funding agencies monitoring is thought to be unscientific, not leading to progress, and more stamp collecting. So we have to establish that, like the Weather Bureau every country supports, we must have an equivalent ecological monitoring bureau. We do have these bureaus for some ecological systems that make money, like marine fisheries, but most other ecosystems are left in limbo with little or no funding on the generalized assumption that “mother or father nature will take care of itself” or expressed more elegantly by a cabinet minister who must be nameless, “there is no need for more forestry research, as we know everything we need to know already”. The urge by politicians to cut research funding lives too much in environmental research.

But ecologists are not just ‘stamp collectors’ as some might think. We need to develop generality but at a time scale and a spatial scale that is reliable and useful for the resolution of the problem that gave rise to the research. Typically for ecological issues this time scale would be 10-25 years, and a rule of thumb might be for 10 generations of the organisms being studied. For many of our questions an annual scale might be most useful, but for long-lived plants and animals we must be thinking of decades or even centuries. Some practical examples from Pacifici et al. (2013): If you study field voles (Microtus spp.) typically you can complete your studies of 10 generations in 3.5 years (on average). If you study red squirrels (Tamiasciurus hudsonicus), the same 10 generations will cost you 39 years, and if red foxes (Vulpes vulpes) 58 years. If wildebeest (Connochaetes taurinus) in the Serengeti, 10 generations will take you 80 years, and if you prefer red kangaroos (Macropus rufus) it will take about 90 years. All these estimates are very approximate but they give you an idea of what the time scale of a long-term study might be. Except for the rodent example, all these study durations are nearly impossible to achieve, and the question for ecologists is this: Should we be concerned about these time scales, or should we scale everything to the human research time scale?

The spatial scale has expanded greatly for ecologists with the advent of radio transmitters and the possibility of satellite tracking. These technological advances allow many conservation questions regarding bird migration to be investigated (e.g. Oppel et al. 2015). But no matter what the spatial scale of interest in a research or management program, variation among individuals and sites must be analyzed by means of the replication of measurements or manipulations at several sites. The spatial scale is dictated by the question under investigation, and the issue of fragmentation has focused attention on the importance of spatial movements both for ecological and evolutionary questions (Betts et al. 2014).

And the major question remains: can we construct an adequate theory of ecology from a series of short-term, small area or small container studies?

Betts, M.G., Fahrig, L., Hadley, A.S., Halstead, K.E., Bowman, J., Robinson, W.D., Wiens, J.A. & Lindenmayer, D.B. (2014) A species-centered approach for uncovering generalities in organism responses to habitat loss and fragmentation. Ecography, 37, 517-527. doi: 10.1111/ecog.00740

Oppel, S., Dobrev, V., Arkumarev, V., Saravia, V., Bounas, A., Kret, E., Velevski, M., Stoychev, S. & Nikolov, S.C. (2015) High juvenile mortality during migration in a declining population of a long-distance migratory raptor. Ibis, 157, 545-557. doi: 10.1111/ibi.12258

Pacifici, M., Santini, L., Di Marco, M., Baisero, D., Francucci, L., Grottolo Marasini, G., Visconti, P. & Rondinini, C. (2013) Database on generation length of mammals. Nature Conservation, 5, 87-94. doi: 10.3897/natureconservation.5.5734

Pearse, I.S., Koenig, W.D. & Kelly, D. (2016) Mechanisms of mast seeding: resources, weather, cues, and selection. New Phytologist, 212 (3), 546-562. doi: 10.1111/nph.14114

Climate Change and Ecological Science

One dominant paradigm of the ecological literature at the present time is what I would like to call the Climate Change Paradigm. Stated in its clearest form, it states that all temporal ecological changes now observed are explicable by climate change. The test of this hypothesis is typically a correlation between some event like a population decline, an invasion of a new species into a community, or the outbreak of a pest species and some measure of climate. Given clever statistics and sufficient searching of many climatic measurements with and without time lags, these correlations are often sanctified by p< 0.05. Should we consider this progress in ecological understanding?

An early confusion in relating climate fluctuations to population changes was begun by labelling climate as a density independent factor within the density-dependent model of population dynamics. Fortunately, this massive confusion was sorted out by Enright (1976) but alas I still see this error repeated in recent papers about population changes. I think that much of the early confusion of climatic impacts on populations was due to this classifying all climatic impacts as density-independent factors.

One’s first response perhaps might be that indeed many of the changes we see in populations and communities are indeed related to climate change. But the key here is to validate this conclusion, and to do this we need to talk about the mechanisms by which climate change is acting on our particular species or species group. The search for these mechanisms is much more difficult than the demonstration of a correlation. To become more convincing one might predict that the observed correlation will continue for the next 5 (10, 20?) years and then gather the data to validate the correlation. Many of these published correlations are so weak as to preclude any possibility of validation in the lifetime of a research scientist. So the gold standard must be the deciphering of the mechanisms involved.

And a major concern is that many of the validations of the climate change paradigm on short time scales are likely to be spurious correlations. Those who need a good laugh over the issue of spurious correlation should look at Vigen (2015), a book which illustrates all too well the fun of looking for silly correlations. Climate is a very complex variable and a nearly infinite number of measurements can be concocted with temperature (mean, minimum, maximum), rainfall, snowfall, or wind, analyzed over any number of time periods throughout the year. We are always warned about data dredging, but it is often difficult to know exactly what authors of any particular paper have done. The most extreme examples are possible to spot, and my favorite is this quotation from a paper a few years ago:

“A total of 864 correlations in 72 calendar weather periods were examined; 71 (eight percent) were significant at the p< 0.05 level. …There were 12 negative correlations, p< 0.05, between the number of days with (precipitation) and (a demographic measure). A total of 45- positive correlations, p<0.05, between temperatures and (the same demographic measure) were disclosed…..”

The climate change paradigm is well established in biogeography and the major shifts in vegetation that have occurred in geological time are well correlated with climatic changes. But it is a large leap of faith to scale this well established framework down to the local scale of space and a short-term time scale. There is no question that local short term climate changes can explain many changes in populations and communities, but any analysis of these kinds of effects must consider alternative hypotheses and mechanisms of change. Berteaux et al. (2006) pointed out the differences between forecasting and prediction in climate models. We desire predictive models if we are to improve ecological understanding, and Berteaux et al. (2006) suggested that predictive models are successful if they follow three rules:

(1) Initial conditions of the system are well described (inherent noise is small);

(2) No important variable is excluded from the model (boundary conditions are defined adequately);

(3) Variables used to build the model are related to each other in the proper way (aggregation/representation is adequate).

Like most rules for models, whether these conditions are met is rarely known when the model is published, and we need subsequent data from the real world to see if the predictions are correct.

I am much less convinced that forecasting models are useful in climate research. Forecasting models describe an ecological situation based on correlations among the measurements available with no clear mechanistic model of the ecological interactions involved. My concern was highlighted in a paper by Myers (1998) who investigated for fish populations the success of published juvenile recruitment-environmental factor (typically temperature) correlations and found that very few forecasting models were reliable when tested against additional data obtained after publication. It would be useful for someone to carry out a similar analysis for bird and mammal population models.

Small mammals show some promise for predictive models in some ecosystems. The analysis by Kausrud et al. (2008) illustrates a good approach to incorporating climate into predictive explanations of population change in Norwegian lemmings that involve interactions between climate and predation. The best approach in developing these kinds of explanations and formulating them into models is to determine how the model performs when additional data are obtained in the years to follow publication.

The bottom line is to avoid spurious climatic correlations by describing and evaluating mechanistic models that are based on observable biological factors. And then make predictions that can be tested in a realistic time frame. If we cannot do this, we risk publishing fairy tales rather than science.

Berteaux, D., et al. (2006) Constraints to projecting the effects of climate change on mammals. Climate Research, 32, 151-158. doi: 10.3354/cr032151

Enright, J. T. (1976) Climate and population regulation: the biogeographer’s dilemma. Oecologia, 24, 295-310.

Kausrud, K. L., et al. (2008) Linking climate change to lemming cycles. Nature, 456, 93-97. doi: 10.1038/nature07442

Myers, R. A. (1998) When do environment-recruitment correlations work? Reviews in Fish Biology and Fisheries, 8, 285-305. doi: 10.1023/A:1008828730759

Vigen, T. (2015) Spurious Correlations, Hyperion, New York City. ISBN: 978-031-633-9438

On Statistical Progress in Ecology

There is a general belief that science progresses over time and given that the number of scientists is increasing, this is a reasonable first approximation. The use of statistics in ecology has been one of ever increasing improvements of methods of analysis, accompanied by bandwagons. It is one of these bandwagons that I want to discuss here by raising the general question:

Has the introduction of new methods of analysis in biological statistics led to advances in ecological understanding?

This is a very general question and could be discussed at many levels, but I want to concentrate on the top levels of statistical inference by means of old-style frequentist statistics, Bayesian methods, and information theoretic methods. I am prompted to ask this question because of my reviewing of many papers submitted to ecological journals in which the data are so buried by the statistical analysis that the reader is left in a state of confusion whether or not any progress has been made. Being amazed by the methodology is not the same as being impressed by the advance in ecological understanding.

Old style frequentist statistics (read Sokal and Rohlf textbook) has been criticized for concentrating on null hypothesis testing when everyone knows the null hypothesis is not correct. This has led to refinements in methods of inference that rely on effect size and predictive power that is now the standard in new statistical texts. Information-theoretic methods came in to fill the gap by making the data primary (rather than the null hypothesis) and asking the question which of several hypotheses best fit the data (Anderson et al. 2000). The key here was to recognize that one should have prior expectations or several alternative hypotheses in any investigation, as recommended in 1897 by Chamberlin. Bayesian analysis furthered the discussion not only by having several alternative hypotheses but by the ability to use prior information in the analysis (McCarthy and Masters 2006). Implicit in both information theoretic and Bayesian analysis is the recognition that all of the alternative hypotheses might be incorrect, and that the hypothesis selected as ‘best’ might have very low predictive power.

Two problems have arisen as a result of this change of focus in model selection. The first is the problem of testability. There is an implicit disregard for the old idea that models or conclusions from an analysis should be tested with further data, preferably with data obtained independently from the original data used to find the ‘best’ model. The assumption might be made that if we get further data, we should add it to the prior data and update the model so that it somehow begins to approach the ‘perfect’ model. This was the original definition of passive adaptive management, which is now suggested to be a poor model for natural resource management. The second problem is that the model selected as ‘best’ may be of little use for natural resource management because it has little predictability. In management issues for conservation or exploitation of wildlife there may be many variables that affect population changes and it may not be possible to conduct active adaptive management for all of these variables.

The take home message is that we need in the conclusions of our papers to have a measure of progress in ecological insight whatever statistical methods we use. The significance of our research will not be measured by the number of p-values, AIC values, BIC values, or complicated tables. The key question must be: What new ecological insights have been achieved by these methods?

Anderson, D.R., Burnham, K.P., and Thompson, W.L. 2000. Null hypothesis testing: problems, prevalence, and an alternative. Journal of Wildlife Management 64(4): 912-923.

Chamberlin, T.C. 1897. The method of multiple working hypotheses. Journal of Geology 5: 837-848 (reprinted in Science 148: 754-759 in 1965). doi:10.1126/science.148.3671.754.

McCarthy, M.A., and Masters, P.I.P. 2005. Profiting from prior information in Bayesian analyses of ecological data. Journal of Applied Ecology 42(6): 1012-1019. doi:10.1111/j.1365-2664.2005.01101.x.

Walters, C. 1986. Adaptive Management of Renewable Resources. Macmillan, New York.


Hypothesis testing using field data and experiments is definitely NOT a waste of time

At the ESA meeting in 2014 Greg Dwyer (University of Chicago) gave a talk titled “Trying to understand ecological data without mechanistic models is a waste of time.” This theme has recently been reiterated on Dynamic Ecology Jeremy Fox, Brian McGill and Megan Duffy’s blog (25 January 2016 https://dynamicecology.wordpress.com/2016/01/25/trying-to-understand-ecological-data-without-mechanistic-models-is-a-waste-of-time/).  Some immediate responses to this blog have been such things as “What is a mechanistic model?” “What about the use of inappropriate statistics to fit mechanistic models,” and “prediction vs. description from mechanistic models”.  All of these are relevant and interesting issues in interpreting the value of mechanistic models.

The biggest fallacy however in this blog post or at least the title of the blog post is the implication that field ecological data are collected in a vacuum.  Hypotheses are models, conceptual models, and it is only in the absence of hypotheses that trying to understand ecological data is a “waste of time”. Research proposals that fund field work demand testable hypotheses, and testing hypotheses advances science. Research using mechanistic models should also develop testable hypotheses, but mechanistic models are certainly are not the only route to hypothesis creation of testing.

Unfortunately, mechanistic models rarely identify how the robustness and generality of the model output could be tested from ecological data and often fail comprehensively to properly describe the many assumptions made in constructing the model. In fact, they are often presented as complete descriptions of the ecological relationships in question, and methods for model validation are not discussed. Sometimes modelling papers include blatantly unrealistic functions to simplify ecological processes, without exploring the sensitivity of results to the functions.

I can refer to my own area of research expertise, population cycles for an example here.  It is not enough for example to have a pattern of ups and downs with a 10-year periodicity to claim that the model is an acceptable representation of cyclic population dynamics of for example a forest lepidopteran or snowshoe hares. There are many ways to get cyclic dynamics in modeled systems. Scientific progress and understanding can only be made if the outcome of conceptual, mechanistic or statistical models define the hypotheses that could be tested and the experiments that could be conducted to support the acceptance, rejection or modification of the model and thus to inform understanding of natural systems.

How helpful are mechanistic models – the gypsy moth story

Given the implication of Dwyer’s blog post (or at least blog post title) that mechanistic models are the only way to ecological understanding, it is useful to look at models of gypsy moth dynamics, one of Greg’s areas of modeling expertise, with the view toward evaluating whether model assumptions are compatible with real-world data Dwyer et al.  2004  (http://www.nature.com/nature/journal/v430/n6997/abs/nature02569.html)

Although there has been considerable excellent work on gypsy moth over the years, long-term population data are lacking.  Population dynamics therefore are estimated by annual estimates of defoliation carried out by the US Forest Service in New England starting in 1924. These data show periods of non-cyclicity, two ten-year cycles (peaks in 1981 and 1991 that are used by Dwyer for comparison to modeled dynamics for a number of his mechanistic models) and harmonic 4-5 year cycles between 1943 and1979 and since the 1991 outbreak. Based on these data 10-year cycles are the exception not the rule for introduced populations of gypsy moth. Point 1. Many of the Dwyer mechanistic models were tested using the two outbreak periods and ignored over 20 years of subsequent defoliation data lacking 10-year cycles. Thus his results are limited in their generality.

As a further example a recent paper, Elderd et al. (2013)  (http://www.ncbi.nlm.nih.gov/pmc/articles/PMC3773759/) explored the relationship between alternating long and short cycles of gypsy moth in oak dominated forests by speculating that inducible tannins in oaks modifies the interactions between gypsy moth larvae and viral infection. Although previous field experiments (D’Amico et al. 1998) http://onlinelibrary.wiley.com/doi/10.1890/0012-9658(1998)079%5b1104:FDDNAW%5d2.0.CO%3b2/abstract concluded that gypsy moth defoliation does not affect tannin levels sufficiently to influence viral infection, Elderd et al. (2013) proposed that induced tannins in red oak foliage reduces variation in viral infection levels and promotes shorter cycles. In this study, an experiment was conducted using jasmonic acid sprays to induce oak foliage. Point 2 This mechanistic model is based on experiments using artificially induced tannins as a mimic of insect damage inducing plant defenses. However, earlier fieldwork showed that foliage damage does not influence virus transmission and thus does not support the relevance of this mechanism.

In this model Elderd et al. (2013) use a linear relationship for viral transmission (transmission of infection on baculovirus density) based on two data points and the 0 intercept. In past mechanistic models and in a number of other systems the relationship between viral transmission and host density is nonlinear (D’Amico et al. 2005, http://onlinelibrary.wiley.com/doi/10.1111/j.0307-6946.2005.00697.x/abstract;jsessionid=D93D281ACD3F94AA86185EFF95AC5119.f02t02?userIsAuthenticated=false&deniedAccessCustomisedMessage= Fenton et al. 2002, http://onlinelibrary.wiley.com/doi/10.1046/j.1365-2656.2002.00656.x/full). Point 3. Data are insufficient to accurately describe the viral transmission relationship used in the model.

Finally the Elderd et al. (2013) model considers two types of gypsy moth habitat – one composed of 43% oaks that are inducible and the other of 15% oaks and the remainder of the forest composition is in adjacent blocks of non-inducible pines. Data show that gypsy moth outbreaks are limited to areas with high frequencies of oaks. In mixed forests, pines are only fed on by later instars of moth larvae when oaks are defoliated. The pines would be interspersed amongst the oaks not in separate blocks as in the modeled population. Point 4.  Patterns of forest composition in the models that are crucial to the result are unrealistic and this makes the interpretation of the results impossible.

Point 5 and conclusion. Because it can be very difficult to critically review someone else’s mechanistic model as model assumptions are often hidden in supplementary material and hard to interpret, and because relationships used in models are often arbitrarily chosen and not based on available data, it could be easy to conclude that “mechanistic models are misleading and a waste of time”. But of course that wouldn’t be productive. So my final point is that closer collaboration between modelers and data collectors would be the best way to ensure that the models are reasonable and accurate representations of the data.  In this way understanding and realistic predictions would be advanced. Unfortunately the great push to publish high profile papers works against this collaboration and manuscripts of mechanistic models rarely include data savvy referees.

D’Amico, V., J. S. Elkinton, G. Dwyer, R. B. Willis, and M. E. Montgomery. 1998. Foliage damage does not affect within-season transmission of an insect virus. Ecology 79:1104-1110.

D’Amico, V. D., J. S. Elkinton, P. J.D., J. P. Buonaccorsi, and G. Dwyer. 2005. Pathogen clumping: an explanation for non-linear transmission of an insect virus. Ecological Entomology 30:383-390.

Dwyer, G., F. Dushoff, and S. H. Yee. 2004. The combined effects of pathogens and predators on insect outbreaks. Nature 430:341-345.

Elderd, B. D., B. J. Rehill, K. J. Haynes, and G. Dwyer. 2013. Induced plant defenses, host–pathogen interactions, and forest insect outbreaks. Proceedings of the National Academy of Sciences 110:14978-14983.

Fenton, A., J. P. Fairbairn, R. Norman, and P. J. Hudson. 2002. Parasite transmission: reconciling theory and reality. Journal of Animal Ecology 71:893-905.

On Log-Log Regressions

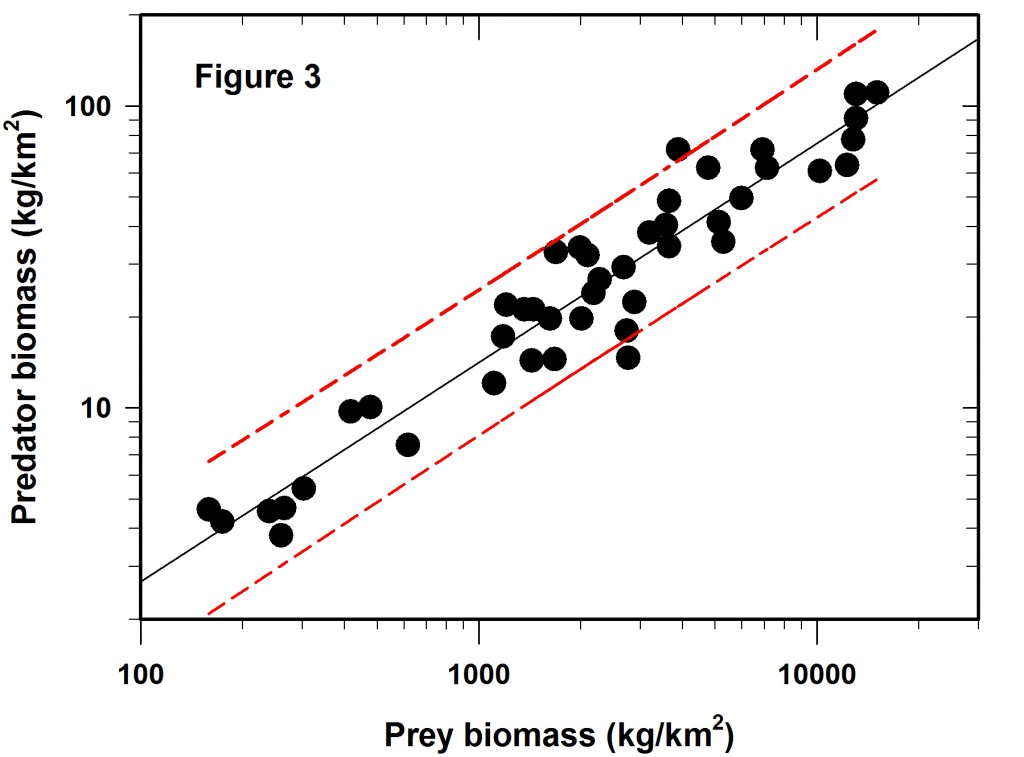
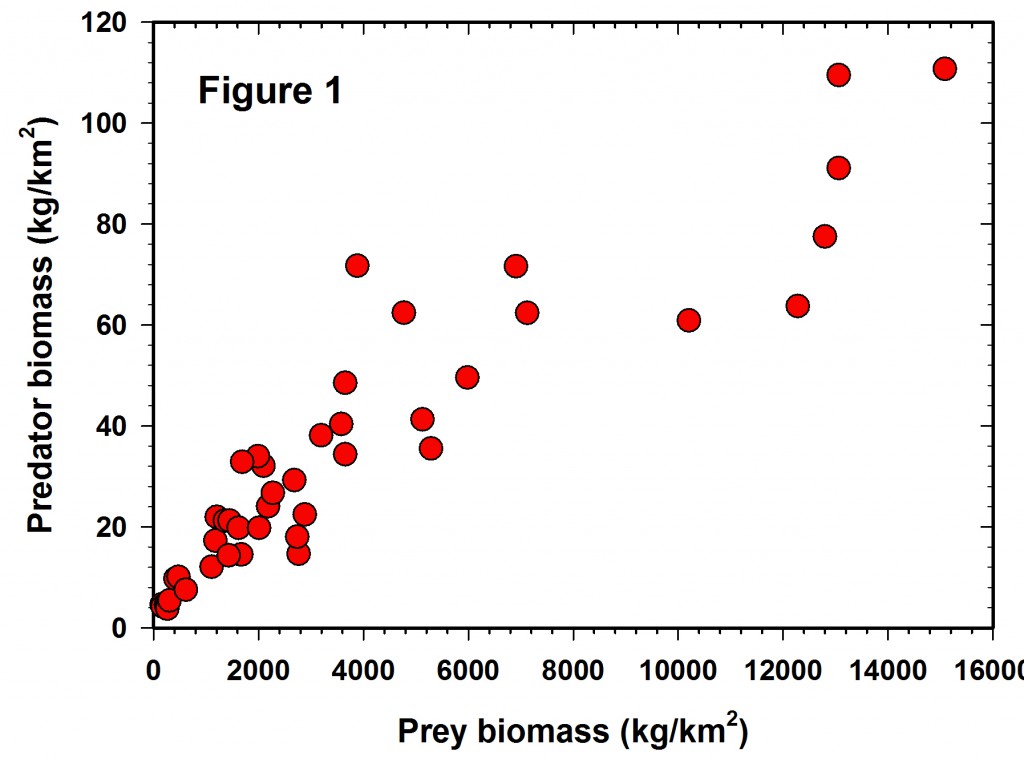
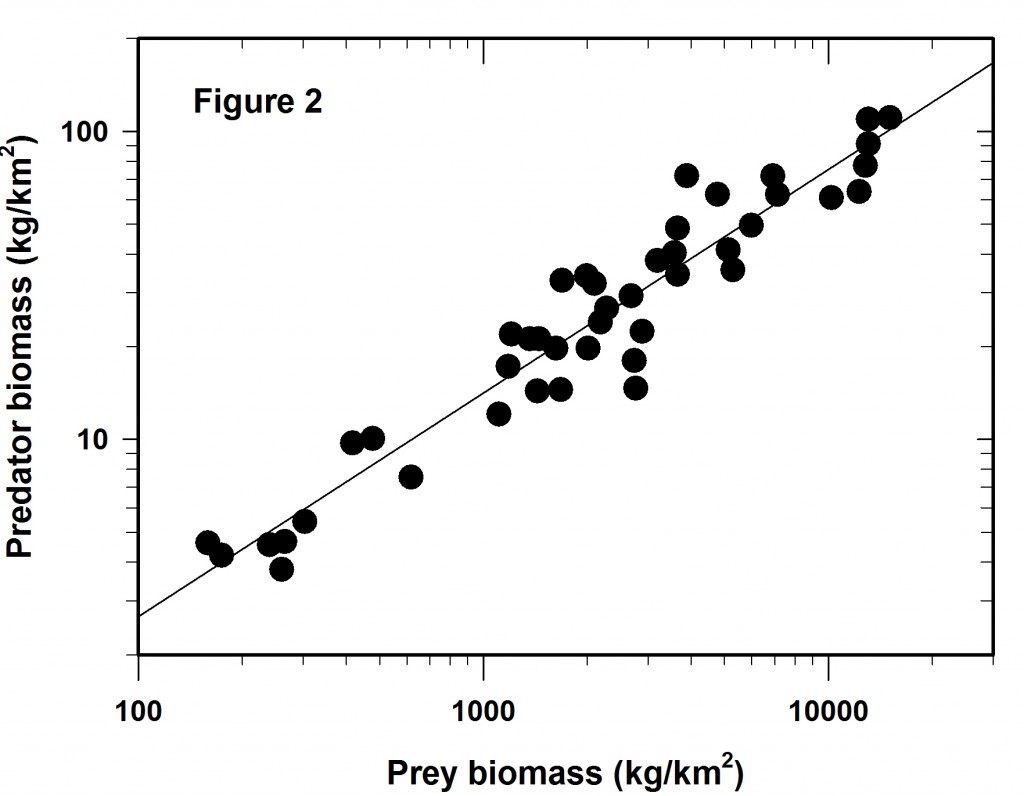
Log-log regressions are commonly used in ecological papers, and my attention to their limitations was twigged by a recent paper by Hatton et al. (2015) in Science. I want to look at just one example of a log-log regression from this paper as an illustration of what I think might be some pitfalls of this approach. The regression under discussion is Figure 1 in the Hatton paper, a plot of predator biomass (Y) on prey biomass (X) for a variety of African large mammal ecosystems. I emphasize that this is a critique of log-log regression problems, not a detailed critique of this paper.

Figure 1 shows the raw data reported in the Hatton et al. (2015) paper but plotted in arithmetic space. It is clear that the variance increases with the mean and the data are highly variable, as well as slightly curvilinear, so a transformation is clearly desirable for statistical analysis. Unfortunately we are given no error bars on each of the point estimates, so it is not possible to plot confidence limits for each estimate.

Figure 1A

We log both the axes and get Figure 2 which is identical to that plotted as Figure 1 in Hatton et al. (2015). Clearly the regression fit is better that that of Figure 1 and yet there is still considerable variation around the line of best fit.

Figure 2A

The variation around this log-log line is the main issue I wish to discuss here. Much depends on the reason for the regression line. Mac Nally (2000) made the point that regressions are often used for predictive purposes but sometimes used only as explanations. I assume here one wishes this to be a predictive regression.

So the next question is if the Figure 2 regression is predictive, how wide are the confidence limits? In this case we will adopt the usual 95% confidence predictions for a single data point. The result is shown in Figure 3, which did not appear in the Science article. The red lines define the 95% confidence belt.

Figure 3A

Now comes the main point of my concerns with log-log regressions. What do these error limits really mean when they are translated back to the original measurements that define the graph?

The table given below gives the prediction intervals for a hypothetical set of 8 prey abundances scattered along the span of prey densities reported.

Prey abundance (kg/km2)

Estimated predator abundance (kg/km2)

Predicted lower 95% confidence limit

Predicted upper 95% confidence limit

Width of lower confidence interval (%)

Width of upper confidence interval (%)

200

4.4

2.46

7.74

-44%

+76%

1000

14.1

8.16

24.6

-42%

+74%

1500

19.0

11.0

33.2

-42%

+70%

2000

23.4

13.2

41.0

-44%

+75%

4000

38.7

22.4

69.0

-42%

+78%

8000

64.0

35.4

113.6

-45%

+78%

10000

75.2

43.6

134.4

-42%

+79%

12000

85.8

49.0

147.6

-43%

+72%

The overall average confidence limits for this log-log regression are -43% to +75%, given that the SE of the predictions varies little across the range of values used in the regression. These are very broad confidence limits for any prediction from a regression line.

The bottom line is that log-log regressions can camouflage a great deal of variation, which may or may not be acceptable depending on the use of the regression. These plots always visually look much better than they are. You probably already knew this but I worry that it is a point that can be easily overlooked.

Lastly, a minor quibble with this regression. Some authors (e.g. Ricker 1983, Smith 2009) have discussed the issue of using the reduced major axis (or geometric mean regression) when the X variable is measured with error instead of the standard regression method. One could argue for this particular data set that the X variable is measured with error, so that I have used a reduced major axis regression in this discussion. The overall conclusions are not changed if standard regression methods are used.

Hatton, I.A., McCann, K.S., Fryxell, J.M., Davies, T.J., Smerlak, M., Sinclair, A.R.E. & Loreau, M. (2015) The predator-prey power law: Biomass scaling across terrestrial and aquatic biomes. Science 349 (6252). doi: 10.1126/science.aac6284

Mac Nally, R. (2000) Regression and model-building in conservation biology, biogeography and ecology: The distinction between – and reconciliation of – ‘predictive’ and ‘explanatory’ models. Biodiversity & Conservation, 9, 655-671. doi: 10.1023/A:1008985925162

Ricker, W.E. (1984) Computation and uses of central trend lines. Canadian Journal of Zoology 62 (10), 1897-1905.doi: 10.1139/z84-279

Smith, R.J. (2009) Use and misuse of the reduced major axis for line-fitting. American Journal of Physical Anthropology, 140, 476-486. doi: 10.1002/ajpa.21090

The Volkswagen Syndrome and Ecological Science

We have all been hearing the reports that Volkswagen fixed diesel cars by some engineering trick to show low levels of pollution, while the actual pollution produced on the road is 10-100 times higher than the laboratory predicted pollution levels. I wonder if this is an analogous situation to what we have in ecology when we compare laboratory studies and conclusions to real-world situations.

The push in ecology has always been to simplify the system first by creating models full of assumptions, and then by laboratory experiments that are greatly oversimplified compared with the real world. There are very good reasons to try to do this, since the real world is rather complicated, but I wonder if we should call a partial moratorium on such research by conducting a review of how far we have been led astray by both simple models and simple laboratory population, community and ecosystem studies in microcosms and mesocosms. I can almost hear the screams coming up that of course this is not possible since graduate students must complete a degree in 2 or 3 years, and postdocs must do something in 2 years. If this is our main justification for models and microcosms, that is fair enough but we ought to be explicit about stating that and then evaluate how much we have been misled by such oversimplification.

Let me try to be clear about this problem. It is an empirical question of whether or not studies in laboratory or field microcosms can give us reliable generalizations for much more extensive communities and ecosystems that are not in some sense space limited or time limited. I have a personal view on this question, heavily influenced by studies of small mammal populations in microcosms. But my experience may be atypical of the rest of natural systems, and this is an empirical question, not one on which we can simply state our opinions.

If the world is much more complex than our current understanding of it, we must conclude that an extensive list of climate change papers should be moved to the fiction section of our libraries. If we assume equilibrial dynamics in our communities and ecosystems, we fly in violation of almost all long term studies of populations, communities, and ecosystems. The problem lies in the space and time vision of our science. Our studies are too short to show even a good representation of dynamics over a 100 year time scale, and the problems of landscape ecology highlight that what we see in patch A may be greatly influenced by whether patches B and C are close by or not. We see this darkly in a few small studies but are compelled to believe that such landscape effects are unusual or atypical. This may in fact be the case, but we need much more work to see if it is rare or common. And the broader issue is what use do we as ecologists have for ecological predictions that cannot be tested without data for the next 100 years?

Are all our grand generalizations of ecology falling by the wayside without us noticing it? Prins and Gordon (2014) in their overview seem to feel that the real world is poorly reflected in many of our beloved theories. I think this is a reflection of the Volkswagen Syndrome, of the failure to appreciate that the laboratory in its simplicity is so far removed from real world community and ecosystem dynamics that we ought to start over to build an ecological edifice of generalizations or rules with a strong appreciation of the limited validity of most generalizations until much more research has been done. The complications of the real world can be ignored in the search for simplicity, but one has to do this with the realization that predictions that flow from faulty generalizations can harm our science. We ecologists have very much research yet to do to establish secure generalizations that lead to reliable predictions.

Prins, H.H.T. & Gordon, I.J. (2014) Invasion Biology and Ecological Theory: Insights from a Continent in Transformation. Cambridge University Press, Cambridge. 540 pp. ISBN 9781107035812.

On Tipping Points and Regime Shifts in Ecosystems

A new important paper raises red flags about our preoccupation with tipping points, alternative stable states and regime shifts (I’ll call them collectively sharp transitions) in ecosystems (Capon et al. 2015). I do not usually call attention to papers but this paper and a previous review (Mac Nally et al. 2014) seem to me to be critical for how we think about ecosystem changes in both aquatic and terrestrial ecosystems.

Consider an oversimplified example of how a sharp transition might work. Suppose we dumped fertilizer into a temperate clear-water lake. The clear water soon turns into pea soup with a new batch of algal species, a clear shift in the ecosystem, and this change is not good for many of the invertebrates or fish that were living there. Now suppose we stop dumping fertilizer into the lake. In time, and this could be a few years, the lake can either go back to its original state of clear water or it could remain as a pea soup lake for a very long time even though the pressure of added fertilizer was stopped. This second outcome would be a sharp transition, “you cannot go back from here” and the question for ecologists is how often does this happen? Clearly the answer is of great interest to natural resource managers and restoration ecologists.

The history of this idea for me was from the 1970s at UBC when Buzz Holling and Carl Walters were modelling the spruce budworm outbreak problem in eastern Canadian coniferous forests. They produced a model with a manifold surface that tipped the budworm from a regime of high abundance to one of low abundance (Holling 1973). We were all suitably amazed and began to wonder if this kind of thinking might be helpful in understanding snowshoe hare population cycles and lemming cycles. The evidence was very thin for the spruce budworm, but the model was fascinating. Then by the 1980s the bandwagon started to roll, and alternative stable states and regime change seemed to be everywhere. Many ideas about ecosystem change got entangled with sharp transition, and the following two reviews help to unravel them.

Of the 135 papers reviewed by Capon et al. (2015) very few showed good evidence of alternative stable states in freshwater ecosystems. They highlighted the use and potential misuse of ecological theory in trying to predict future ecosystem trajectories by managers, and emphasized the need of a detailed analysis of the mechanisms causing ecosystem change. In a similar paper for estuaries and near inshore marine ecosystems, Mac Nally et al. (2014) showed that of 376 papers that suggested sharp transitions, only 8 seemed to have sufficient data to satisfy the criteria needed to conclude that a transition had occurred and was linkable to an identifiable pressure. Most of the changes described in these studies are examples of gradual ecosystem changes rather than a dramatic shift; indeed, the timescale against which changes are assessed is critical. As always the devil is in the details.

All of this is to recognize that strong ecosystem changes do occur in response to human actions but they are not often sharp transitions that are closely linked to human actions, as far as we can tell now. And the general message is clearly to increase rigor in our ecological publications, and to carry out the long-term studies that provide a background of natural variation in ecosystems so that we have a ruler to measure human induced changes. Reviews such as these two papers go a long way to helping ecologists lift our game.

Perhaps it is best to end with part of the abstract in Capon et al. (2015):

“We found limited understanding of the subtleties of the relevant theoretical concepts and encountered few mechanistic studies that investigated or identified cause-and-effect relationships between ecological responses and nominal pressures. Our results mirror those of reviews for estuarine, nearshore and marine aquatic ecosystems, demonstrating that although the concepts of regime shifts and alternative stable states have become prominent in the scientific and management literature, their empirical underpinning is weak outside of a specific environmental setting. The application of these concepts in future research and management applications should include evidence on the mechanistic links between pressures and consequent ecological change. Explicit consideration should also be given to whether observed temporal dynamics represent variation along a continuum rather than categorically different states.”


Capon, S.J., Lynch, A.J.J., Bond, N., Chessman, B.C., Davis, J., Davidson, N., Finlayson, M., Gell, P.A., Hohnberg, D., Humphrey, C., Kingsford, R.T., Nielsen, D., Thomson, J.R., Ward, K., and Mac Nally, R. 2015. Regime shifts, thresholds and multiple stable states in freshwater ecosystems; a critical appraisal of the evidence. Science of The Total Environment 517(0): in press. doi:10.1016/j.scitotenv.2015.02.045.

Holling, C.S. 1973. Resilience and stability of ecological systems. Annual Review of Ecology and Systematics 4: 1-23. doi:10.1146/annurev.es.04.110173.000245.

Mac Nally, R., Albano, C., and Fleishman, E. 2014. A scrutiny of the evidence for pressure-induced state shifts in estuarine and nearshore ecosystems. Austral Ecology 39: 898-906. doi:10.1111/aec.12162.

The Anatomy of an Ecological Controversy – Dingos and Conservation in Australia

Conservation is a most contentious discipline, partly because it is ecology plus a moral stance. As such you might compare it to discussions about religious truths in the last several centuries but it is a discussion among scientists who accept the priority of scientific evidence. In Australia for the past few years there has been much discussion of the role of the dingo in protecting biodiversity via mesopredator release of foxes and cats (Allen et al. 2013; Colman et al. 2014; Hayward and Marlow 2014; Letnic et al. 2011, and many more papers). I do not propose here to declare a winner in this controversy but I want to dissect it as an example of an ecological issue with so many dimensions it could continue for a long time.

Dingos in Australia are viewed like wolves in North America – the ultimate enemy that must be reduced or eradicated if possible. When in doubt about what to do, killing dingos or wolves has become the first commandment of wildlife management and conservation. The ecologist would like to know, given this socially determined goal, what are the ecological consequences of reduction or eradication of dingos or wolves. How do we determine that?

The experimentalist suggests doing a removal experiment (or conversely a re-introduction experiment) so we have ecosystems with and without dingos (Newsome et al. 2015). This would have to be carried out on a large scale dependent on the home range size of the dingo and for a number of years so that the benefits or the costs of the removal would be clear. Here is the first hurdle, this kind of experiment cannot be done, and only a quasi-experiment is possible by finding areas that have dingos and others that do not have any (or a reduced population) and comparing ecosystems. This decision immediately introduces 5 problems:

  1. The areas with- and without- the dingo are not comparable in many respects. Areas with dingos for example may be national parks placed in the mountains or in areas that humans cannot use for agriculture, while areas with dingo control are in fertile agricultural landscapes with farming subsidies.
  2. Even given areas with and without dingos there is the problem of validating the usual dingo reduction carried out by poison baits or shooting. This is an important methodological issue.
  3. One has to census the mesopredators, in Australia foxes and cats, with further methodological issues of how to achieve that with accuracy.
  4. In addition one has to census the smaller vertebrates presumed to be possibly affected by the mesopredator offtake.
  5. Finally one has to do this for several years, possibly 5-10 years, particularly in variable environments, and in several pairs of areas chosen to represent the range of ecosystems of interest.

All in all this is a formidable research program, and one that has been carried out in part by the researchers working on dingos. And we owe them our congratulations for their hard work. The major part of the current controversy has been how one measures population abundance of all the species involved. The larger the organism, paradoxically the more difficult and expensive the methods of estimating abundance. Indirect measures, often from predator tracks in sand plots, are forced on researchers because of a lack of funding and the landscape scale of the problem. The essence of the problem is that tracks in sand or mud measure both abundance and activity. If movements increase in the breeding season, tracks may indicate activity more than abundance. If old roads are the main sampling sites, the measurements are not a random sample of the landscape.

This monumental sampling headache can be eliminated by the bold stroke of concluding with Nimmo et al. (2015) and Stephens et al. (2015) that indirect measures of abundance are sufficient for guiding actions in conservation management. They may be, they may not be, and we fall back into the ecological dilemma that different ecosystems may give different answers. And the background question is what level of accuracy do you need in your study? We are all in a hurry now and want action for conservation. If you need to know only whether you have “few” or “many” dingos or tigers in your area, indirect methods may well serve the purpose. We are rushing now into the “Era of the Camera” in wildlife management because the cost is low and the volume of data is large. Camera ecology may be sufficient for occupancy questions, but may not be enough for demographic analysis without detailed studies.

The moral issue that emerges from this particular dingo controversy is similar to the one that bedevils wolf control in North America and Eurasia – should we remove large predators from ecosystems? The ecologist’s job is to determine the biodiversity costs and benefits of such actions. But in the end we are moral beings as well as ecologists, and for the record, not the scientific record but the moral one, I think it is poor policy to remove dingos, wolves, and all large predators from ecosystems. Society however seems to disagree.


Allen, B.L., Allen, L.R., Engeman, R.M., and Leung, L.K.P. 2013. Intraguild relationships between sympatric predators exposed to lethal control: predator manipulation experiments. Frontiers in Zoology 10(39): 1-18. doi:10.1186/1742-9994-10-39.

Colman, N.J., Gordon, C.E., Crowther, M.S., and Letnic, M. 2014. Lethal control of an apex predator has unintended cascading effects on forest mammal assemblages. Proceedings of the Royal Society of London, Series B 281(1803): 20133094. doi:DOI: 10.1098/rspb.2013.3094.

Hayward, M.W., and Marlow, N. 2014. Will dingoes really conserve wildlife and can our methods tell? Journal of Applied Ecology 51(4): 835-838. doi:10.1111/1365-2664.12250.

Letnic, M., Greenville, A., Denny, E., Dickman, C.R., Tischler, M., Gordon, C., and Koch, F. 2011. Does a top predator suppress the abundance of an invasive mesopredator at a continental scale? Global Ecology and Biogeography 20(2): 343-353. doi:10.1111/j.1466-8238.2010.00600.x.

Newsome, T.M., et al. (2015) Resolving the value of the dingo in ecological restoration. Restoration Ecology, 23 (in press). doi: 10.1111/rec.12186

Nimmo, D.G., Watson, S.J., Forsyth, D.M., and Bradshaw, C.J.A. 2015. Dingoes can help conserve wildlife and our methods can tell. Journal of Applied Ecology 52. (in press, 27 Jan. 2015). doi:10.1111/1365-2664.12369.

Stephens, P.A., Pettorelli, N., Barlow, J., Whittingham, M.J., and Cadotte, M.W. 2015. Management by proxy? The use of indices in applied ecology. Journal of Applied Ecology 52(1): 1-6. doi:10.1111/1365-2664.12383.

A Survey of Strong Inference in Ecology Papers: Platt’s Test and Medawar’s Fraud Model

In 1897 Chamberlin wrote an article in the Journal of Geology on the method of multiple working hypotheses as a way of experimentally testing scientific ideas (Chamberlin 1897 reprinted in Science). Ecology was scarcely invented at that time and this has stimulated my quest here to see if current ecology journals subscribe to Chamberlin’s approach to science. Platt (1964) formalized this approach as “strong inference” and argued that it was the best way for science to progress rapidly. If this is the case (and some do not agree that this approach is suitable for ecology) then we might use this model to check now and then on the state of ecology via published papers.

I did a very small survey in the Journal of Animal Ecology for 2015. Most ecologists I hope would classify this as one of our leading journals. I asked the simple question of whether in the Introduction to each paper there were explicit hypotheses stated and explicit alternative hypotheses, and categorized each paper as ‘yes’ or ‘no’. There is certainly a problem here in that many papers stated a hypothesis or idea they wanted to investigate but never discussed what the alternative was, or indeed if there was an alternative hypothesis. As a potential set of covariates, I tallied how many times the word ‘hypothesis’ or ‘hypotheses’ occurred in each paper, as well as the word ‘test’, ‘prediction’, and ‘model’. Most ‘model’ and ‘test’ words were used in the context of statistical models or statistical tests of significance. Singular and plural forms of these words were all counted.

This is not a publication and I did not want to spend the rest of my life looking at all the other ecology journals and many issues, so I concentrated on the Journal of Animal Ecology, volume 84, issues 1 and 2 in 2015. I obtained these results for the 51 articles in these two issues: (number of times the word appeared per article, averaged over all articles)

Explicit hypothesis and alternative hypotheses

“Hypothesis”

“Test”

“Prediction”

“Model”

Yes

22%

Mean

3.1

7.9

6.5

32.5

No

78%

Median

1

6

4

20

No. articles

51

Range

0-23

0-37

0-27

0-163

There are lots of problems with a simple analysis like this and perhaps its utility may lie in stimulating a more sophisticated analysis of a wider variety of journals. It is certainly not a random sample of the ecology literature. But maybe it gives us a few insights into ecology 2015.

I found the results quite surprising in that many papers failed Platt’s Test for strong inference. Many papers stated hypotheses but failed to state alternative hypotheses. In some cases the implied alternative hypothesis is the now-discredited null hypothesis (Johnson 2002). One possible reason for the failure to state hypotheses clearly was discussed by Medawar many years ago (Howitt and Wilson 2014; Medawar 1963). He pointed out that most scientific papers were written backwards, analysing the data, finding out what it concluded, and then writing the introduction to the paper knowing the results to follow. A significant number of papers in these issues I have looked at here seem to have been written following Medawar’s “fraud model”.

But make of such data as you will, and I appreciate that many people write papers in a less formal style than Medawar or Platt would prefer. And many have alternative hypotheses in mind but do not write them down clearly. And perhaps many referees do not think we should be restricted to using the hypothetical deductive approach to science. All of these points of view should be discussed rather than ignored. I note that some ecological journals now turn back papers that have no clear statement of a hypothesis in the introduction to the submitted paper.

The word ‘model’ is the most common word to appear in this analysis, typically in the case of a statistical model evaluated by AIC kinds of statistics. And the word ‘test’ was most commonly used in statistical tests (‘t-test’) in a paper. Indeed virtually all of these paper overflow with statistical estimates of various kinds. Few however come back in the conclusions to state exactly what progress has been made by their paper and even less make statements about what should be done next. From this small survey there is considerable room for improvement in ecological publications.

Chamberlin, T.C. 1897. The method of multiple working hypotheses. Journal of Geology 5: 837-848 (reprinted in Science 148: 754-759 in 1965). doi:10.1126/science.148.3671.754

Howitt, S.M., and Wilson, A.N. 2014. Revisiting “Is the scientific paper a fraud?”. EMBO reports 15(5): 481-484. doi:10.1002/embr.201338302

Johnson, D.H. (2002) The role of hypothesis testing in wildlife science. Journal of Wildlife Management 66(2): 272-276. doi: 10.2307/3803159

Medawar, P.B. 1963. Is the scientific paper a fraud? In “The Threat and the Glory”. Edited by P.B. Medawar. Harper Collins, New York. pp. 228-233. (Reprinted by Harper Collins in 1990. ISBN: 9780060391126.)

Platt, J.R. 1964. Strong inference. Science 146: 347-353. doi:10.1126/science.146.3642.347