
Basically, here is some easy code to search publicly available databases to determine a trait value for a species (in this case whether or not the species was recorded as invasive in any of 5 global invasive species databases), then make a quick tree based on published phylogenies using Phylomatic (http://phylodiversity.net/phylomatic/), then color code the tree based on the trait value.
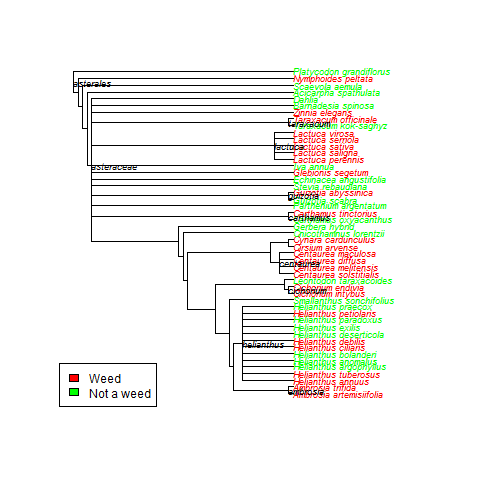
Subset of species from Asteraceae and whether they have been reported as invasive (‘weedy’) in any of 5 global invasive species databases.
Below, reposted from my blog.
The helpful folks over at rOpenSci have come up with exactly the tool I needed, exactly when I needed it.
I had a list of plant species, and I needed to determine which had ever been categorized as “invasive” and which had not. The taxize package easily lets you check 5 global databases, curated by the Encyclopedia of Life, to assess invasive status. Done!
Then I needed to know how invasiveness was distributed across a phylogenetic tree. Given this list of species, how were they related? Well taxize has a tool for building trees from a species list (though currently limited to plants – but all the cool kids are working on plants anyways, right?). Then all I had to do was fiddle with the tree plot a bit to get it to display which species were known to be invasive, based on the database searches. Boom! Done!
The rOpenSci folks liked my tree, so I passed along my code, and now it is all tidied up as a use case for all the world to see! Check it! My original tree is below – sorry for the colors, this was just for my notes.
EDIT: I used the development version of taxize, available on GitHub. You may have some problems with this code if you use the CRAN version. Here’s the code to get the GitHub version:
install.packages("devtools")
library(devtools)
install_github("taxize", "ropensci")
library(taxize)
In my tree, but not in the rOpenSci example tree, Helianthus is displayed as a polytomy. I think this is because I used the feature that labels the nodes, and they did not.