Rik's Treehouse > Babbling in Binary > Tips 'n' Tricks > Gnuplot

Gnuplot

Gnuplot is a great scientific plotting program for viewing data and functions on two or three dimensions. The source code is free and compiled binaries are available for a number of platforms.

  1. Where can I find the binaries?
  2. Is there a quicker way to print graphs?
  3. Where can I find more information?
  4. Is it possible to overlap graphs?
  5. Why is the font so tiny?
  6. How to append commands to the plot file.
  7. How do I restrict the range of the y-axis when fitting?

  1. Where can I find the binaries?
  2. Posted: January 17, 1998

    Problem: Where can I find the latest compiled version of Gnuplot for my platform?

    Solution: The latest compiled version can be found at ftp://ftp.gnuplot.vt.edu/pub/gnuplot/. Check out the README for which version to download.

    Older Apple Macintosh and Power PC versions of Gnuplot can be found at ftp://ftp.ee.gatech.edu/pub/mac/gnuplot/.

    You might also want to check the GnuPlot Beta page if you're still confused.


  3. Is there a quicker way to print graphs?
  4. Posted: January 17, 1998

    Problem: Printing is kind of annoying in Gnuplot. First you have to set the terminal type and redirect the output, then plot the graph, and finally reset the terminal and output back to their defaults--a minimum of five commands. Is there a faster way of doing this?

    Solution: Yes, you can do this with a single command if you download print.plt. It handles all the terminal and output control so all you have to do is type

    gnuplot> load "print.plt"

    and you're done. print.plt is just a standard Gnuplot command file so you can edit as necessary. It is designed for Unix terminals because it pipes the output to the printer via the command set output "|lpr". This probably won't work on a lot of other systems. Also, you need to reset the type of printer if it isn't PostScript.


  5. Where can I find more information?
  6. Posted: January 18, 1998

    Problem: Is there a "frequently asked question" (FAQ) page for Gnuplot?

    Solution: Yes, it is at http://www.ucc.ie/gnuplot/gnuplot-faq.html. It has lots of good information but it might be a little out of date.


  7. Is it possible to overlap graphs?
  8. Posted: January 18, 1998

    Problem: Is there a way to print multiple plots on the same graph?

    Solution: That depends. Version 3.6 supports the command set multiplot which does exactly that and apparently there are some extensions to Gnuplot 3.5 which can also do it but if you want to print to an encapsulated postscript file then there is a shortcut. Just set the terminal and output, and do your plots! They will automatically be overlapped. For example,

    gnuplot> set term postscript eps
    gnuplot> set output 'overlap.ps'
    gnuplot> plot x*x t "function"
    gnuplot> set size 0.4,0.4    # next plot is 40% of the size
    gnuplot> set origin 0.3,0.5  # and shifted 30% right and 50% up
    gnuplot> plot 2*x t "derivative"
    gnuplot> quit
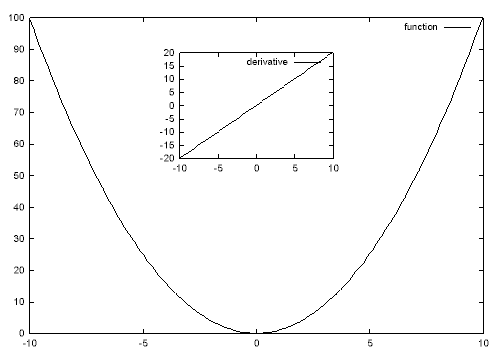
    

    will produce the following:

    overlapping plots

    For more complicated graphs you'll want to modify this procedure a bit. Let's say you've got two (fullsize) graphs and you've saved them to command files a.plt and b.plt. To plot them overlapped you need to manually edit the files with a text editor and remove all lines containing set term ..., set output ..., set size ..., and set origin .... Then, in Gnuplot, type

    gnuplot> set term postscript eps
    gnuplot> set output 'overlap.ps'
    gnuplot> set size 0.5,0.5  # set size and position of a
    gnuplot> set origin 0,0.5
    gnuplot> load 'a.plt'      # plot a
    gnuplot> set size 0.5,0.5  # set size and position of b
    gnuplot> set origin 0.5,0
    gnuplot> load 'b.plt'      # plot b
    gnuplot> quit
    

    I don't know if this is good style for encapsulated postscript files, but it seems to work! The above procedure may also be handy for use with set multiplot in Gnuplot 3.6.


  9. Why is the font so tiny?
  10. Posted: March 6, 1998

    Problem: Sometimes, when I start up Gnuplot (win32 version) the text font is too small to read. Why is this and how can I fix it?

    Solution: You are probably using a font which only accepts particular point sizes. If the selected size is not available (I think) it uses a lookup table to select the best replacement. The lookup table can get confused sometimes so it uses a tiny font. To fix this run Gnuplot and right-click in the command-line area. Select Choose Font... from the menu and pick a new font size that works for you. Don't forget to save your settings by right-clicking again and selecting Update wgnuplot.ini.


  11. How to append commands to the plot file.
  12. Posted: April 6, 1998

    Problem: I use a particular command (such as fit) when plotting, but since it is not essential to the plot it doesn't get saved when I save the plot. How can I append it to the plot file?

    Solution: There are a few ways of doing this (the easiest being to manually edit the plot file with a text editor) but I want to focus on one way in particular. If you are using the Windows version of Gnuplot you can manually edit the menu items by editing the file wgnuplot.mnu in Gnuplot's home folder. What you want to do is add the following lines wherever it's convenient (probably in the File menu):

    	&Append last command
    		{^P} >>"[SAVE]Append to[EOS]*.plt[EOS]"{^A}!command.com /c echo {ENTER}
    
    This command works by...
    1. asking for a plot filename to append to (eg. plot.plt),
    2. jumping up to the previous command and typing >>"plot.plt" at the end of the line,
    3. jumping to the beginning of the line and typing !command.com /c echo, and
    4. hitting the Enter key.

    The >>"plot.plt" string redirects the output to be appended to the file plot.plt. I had to call command.com /c because just calling echo alone didn't seem to support redirection.

    Using this command would look like...

    gnuplot> fit a*x+b 'data.dat' via a,b        (last command)
    gnuplot> !command.com /c echo fit a*x+b 'data.dat' via a,b >>"plot.plt"
    
    I designed this command with the fit command in mind but it might be a handy way to attach other commands, such as pause and reread, too.


  13. How do I restrict the range of the y-axis when fitting?
  14. Posted: May 22, 2002

    Problem: gnuplot 3.7.1 is supposed to be able to fit over a restricted range of y-values with the command fit [xlo:xhi] [ylo:yhi] ... but this feature is broken. Is there a workaround?

    Solution: Of course there is. What I did was to define a set of functions,

    gnuplot> limitlo(x,lo) = (x>lo) ? x : 0/0
    gnuplot> limithi(x,hi) = (x<hi) ? x : 0/0
    gnuplot> limitlohi(x,lo,hi) = limitlo(limithi(x,hi),lo)
    
    which return undefined values if the argument x is outside of the limit. Then you can use them in your fitting as follows:
    gnuplot> ylo=-10; yhi=+10
    gnuplot> fit [*:*] a+b*x 'data.dat' u 1:(limitlohi($2,ylo,yhi)) via a,b
    
    which will tell gnuplot to fit over all values of column 2 ($2) that are between ylo and yhi. It works because gnuplot just throws away anything that doesn't evaluate to a number (eg. 0/0).

    Note that putting the limit function in the fitting function (eg. fit [*:*] limitlohi(a+b*x,ylo,yhi) 'data.dat' u 1:2 via a,b will not work, giving you an Undefined value during function evaluation error message.

    Also note that ylo and yhi are only used once at the beginning of the routine so it won't work to make them depend on fit parameters. (In other words, fit [*:*] a+b*x 'data.dat' u 1:(limitlo($2,a)) via a,b won't do what you expect/hope.)

Top of page
[Rik's Office Hours] [Contact Rik]
Last updated: Fri Apr 30 2004, 1:54pm