Species-at-risk
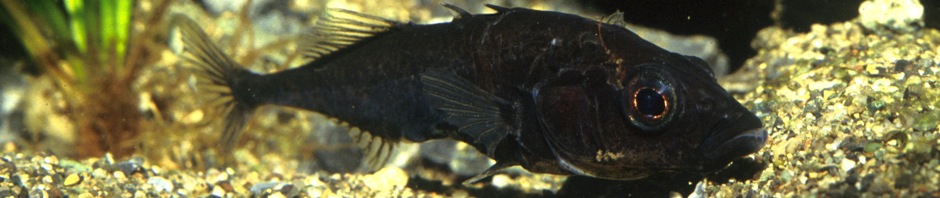
Various threespine stickleback populations in British Columbia are threatened or endangered. The limnetic-benthic species pair in Hadley Lake, Lasqueti Island, is now extinct. The limnetic-benthic species pair in Enos Lake, Vancouver Island, has collapsed to a hybrid swarm (photo of Enos benthic male above, courtesy of Ernie Cooper). Both extinctions were associated with invasive species. Remaining species pairs appear to be healthy but require protection and regular monitoring. A new species pair was discovered in 2007 in Little Quarry Lake, Nelson Island and is becoming listed at SARA.
Status under SARA
Enos Lake species pair: Endangered
Hadley Lake species pair:
Extinct
Little Quarry Lake species pair: pending
Paxton Lake
species pair: Endangered
Vananda Creek species pair: Endangered
The latest information on status can be found on the stickleback page at the SARA Registry
SARA documents
- Report on the Progress of Recovery Strategy Implementation for the Paxton Lake and Vananda Creek Stickleback Species Pairs (Gasterosteus aculeatus) in Canada for the Period 2016 to 2021
- Recovery Strategy for Paxton Lake, Enos Lake, and Vananda Creek Stickleback Species Pairs (Gasterosteus aculeatus) in Canada (2019)
- Stickleback species pairs (Gasterosteus aculeatus): residence description (2019)
- Recovery Strategy for Paxton Lake, Enos Lake, and Vananda Creek Stickleback Species Pairs (Gasterosteus aculeatus) in Canada (2018, proposed)
- Critical habitat for stickleback species pairs (Hatfield 2009)
- Guidelines for the collection and study of the stickleback species pairs. The Recovery Team for Non-Game Freshwater Fish Species in BC (2008)
- Recovery Strategy for Paxton Lake, Enos Lake, and Vananda Creek Stickleback Species Pairs (Gasterosteus spp.) in Canada (2007)
- Recovery Strategy for Paxton Lake, Enos Lake, and Vananda Creek Stickleback Species Pairs (Gasterosteus spp.) in Canada (2006, Proposed)
Population size estimates
Schluter, D., M. Roesti & T. Veen. 2017. Mark-recapture estimates of
stickleback population sizes in Paxton and Priest Lakes in 2016. v5.1.
Unpublished document.
Preprint
|
*Supplement
*Includes recalculation of 2005 population estimates in Paxton
Lake by M. Nomura.
COSEWIC Summaries
Enos Lake species pair. 2012 assessment: Endangered
Hadley Lake species pair. 2000 assessment: Extinct
Little Quarry Lake species pair: Threatened
Paxton Lake species pair. 2010 assessment: Endangered
Vananda Creek species pair (Spectacle, Priest and Emily Lakes). 2010 assessment: Endangered
COSEWIC Reasons for status
Enos Lake species pair
This pair occurred in a single lake in south coastal British Columbia where it has now formed a hybrid swarm. Although it is possible that a small number of genetically-pure fish still exist in the lake, the ongoing presence of an invasive crayfish, and associated habitat degradation, continue to place this species at a high risk of extinction.Hadley Lake species pair
This Canadian endemic fish was known only from Hadley Lake, Lasqueti Island, British Columbia. It was lost as a result of nest predation by the introduced brown bullhead.Paxton Lake species pair
The species are unique Canadian endemics restricted to a single small lake in coastal British Columbia (BC). The wildlife species are highly susceptible to extinction from aquatic invasive species introductions that have been observed to cause rapid extinction of similar species in at least two other lakes. Invasive aquatic species continue to increase in lakes on adjacent Vancouver Island and the lower mainland of BC, and there is, therefore, a reasonable likelihood that invasives could be introduced into the habitat of the species over the next 10 years. The species are also susceptible to habitat loss and degradation from water extraction and land use activities in the surrounding landscape.Vananda Creek species pair
This pair of small freshwater fish are unique Canadian endemics restricted to three small, interconnected lakes in coastal British Columbia (BC). The wildlife species are highly susceptible to extinction from aquatic invasive species introductions that have been observed to cause rapid extinction of similar species in at least two other lakes. Invasive aquatic species continue to increase in lakes on adjacent Vancouver Island and the lower mainland of BC, and there is, therefore, a reasonable likelihood that invasives could be introduced into the habitat of the species over the next 10 years. This species are also susceptible to habitat loss and degradation from water extraction and land use activities in the surrounding landscape.Little Quarry Lake species pair
This pair of small freshwater fish are unique Canadian endemics restricted to one small lake in coastal British Columbia. The wildlife species are highly susceptible to extinction from aquatic invasive species that have been observed to cause rapid extinction of similar species in at least two other lakes. Many invasive aquatic species already occur in southwestern British Columbia, and any range expansion or introduction of new invasive species to Little Quarry Lake would likely lead to the extinction of this species pair.Chinook salmon
Project to discover putatively adaptive SNPs for climate change in fall run chinook salmon by searching for parallel latitudinal gradients in genes of threespine stickleback.
Background
COSEWIC Assessment and Status Report on the Chinook Salmon (Oncorhynchus tshawytscha) in Canada 2018.
Funding
Genome BC SIP003
Team
Project Leader: Dolph Schluter, University of British Columbia
Co-applicant: Ben Koop, University of Victoria, BC.
Co-applicant:
Ruth Withler, Fisheries and Oceans Canada
Co-applicant: Felicity
Jones, Max Planck Society, Tübingen, Germany
Collaborator: David
Kingsley, Stanford University
Collaborator: Sean Rogers, University
of Calgary
Collaborator: Kathleen O’Malley, Oregon State
University
End User: Dr. Brian Riddell, Pacific Salmon
Foundation
End User: Dr. Barb Cannon, Creative Salmon Company
Ltd
Salmon specimens
138 salmon specimens were processed.
Sample information is available here: chinook138sampledata.csv
Salmon files
138 pairs of fastq files
Chinook v1 reference genome used: GCF_002872995.1_Otsh_v1.0_genomic.withSdY.fna.gz
Chinook annotation file: GCF_002872995.1_Otsh_v1.0_genomic.gtf
VQSR training data set: high-quality_otsh_snps_from_Meek_et_al_2016.vcf
Salmon pipeline
Samples were aligned with bwa 0.7.17
Sorted reads using Picard 2.18.9
AddOrReplaceReadGroups using Picard 2.18.9
Called SNPs on samples using HaplotypeCaller in GATK 3.8 with the following arguments.
--genotyping_mode DISCOVERY, --emitRefConfidence GVCFJoint SNP calling using GenotypeGVCFs.
VQSR recalibration carried out using VariantRecalibrator in GATK 3.8 with the following arguments.
-input otsh_set_01.unfiltered.vcf  -recalFile otsh_set_01.snp_var_recal.recal
-tranchesFile otsh_set_01.snp_var_recal.tranches
-resource:meek_et_al_2016,known=false,training=true,truth=true,prior=12.0 high-quality_otsh_snps_from_Meek_et_al_2016.vcf
-resource:otsh_hard_filt,known=false,training=true,truth=false,prior=10.0
otsh_set_01.hardfiltered.maf_0.1.hwe_0.01.recode.vcf
-an QD -an MQ
-an MQRankSum
-an ReadPosRankSum
-an FS -an SOR
-an DP
-an InbreedingCoeff
-mode SNP
Applied recalibration using ApplyRecalibration in GATK 3.8 with the following arguments.
--ts_filter_level 99.0Output vcf file was split into variants and invariants.
Variants were split into separate files by chromosomes and unassembled contigs.
6 filters applied to SNPs using custom scripts in R:- Keep pure snps only (no indels)
- Keep biallelic snps only
- Keep snps that PASSed VQSR
- Keep only SNPs on unmasked RepeatMasker sites in reference genome
- Remove SNPs within 3 bases of an indel
- Keep only snps from first mode of summed depth of coverage
Used SnpStats package in R 3.6.0, R Bioconductor 3.9, to generate SNP matrices for all SNPs passing the filters.
Dropped 26 specimens, retained 112 specimens that met criteria.
          River    N Latitude
    -----------   -- --------
1    Sacramento    6  37.8074
2           Eel    6  40.6477
3        Checto    6  42.0450
4        Salmon    7  45.0478
5      Coweeman    6  46.2604
6       Naselle    5  46.4633
7         Spius    6  49.1154
8     Robertson    6  49.2461
9  Big Qualicum    6  49.3980
10      Quinsam    8  50.0441
11       Marble    6  50.5384
12      Wannock    7  51.6714
13   Chuckwalla    6  51.6998
14      Atnarko    7  52.3793
15       Yakoun    6  53.6566
16      Kitimat    6  54.0055
17    Chickamin    6  55.8224
18     Campbell    6  61.1303
Fitted logistic regression to allele frequency at every SNP against latitude using glm() in R. Saved fitted intercept, slope, “pseudo-P” value from each fit (pseudo because river could not properly be included as a random effect).
Carried out a single randomization of latitude at each SNP, and refitted using glm() in R. Saved intercept, slope and pseudo-P-value from randomization. The frequency distribution of slopes from the randomizations were used as the null distribution for testing significance of observed values for slope. The frequency distribution of pseudo P-values from randomizations were used as the null distribution for observed values of pseudo-P.
SNPs were retained if significant at 99% level according to either slope or pseudo-P values. Remaining SNPs were dropped.
Stickleback files
654 Fastq files from Genome Quebec
Reference genome: gasAcu1pitx1.fa (pitx1 fragment added to gasAcu1.fa)
Used 2 BQSR calibration files: knownSnpsAllchrPitx1new.vcf, stickleback_21genome_SNP_chrM.bed
Used VQSR calibration file: 206sticklebacks_GATKvariants.SNP.filtered.vcf.bgz
Stickleback annotation file, Ensembl v100: Gasterosteus_aculeatus.BROADS1.100.gtf.gz
Stickleback pipeline
654 mainly marine samples were aligned with bwa 0.7.17
Sorted and marked duplicate reads using Picard 2.20.6
AddOrReplaceReadGroups using Picard 2.20.6
Base quality score recalibration in GATK 4.1.2.0
Called SNPs on samples separately by chromosome using HaplotypeCaller in GATK 4.1.2.0 using the following arguments.
--pcr-indel-model NONE
--heterozygosity 0.01
--indel-heterozygosity 0.00125
--output-mode EMIT_ALL_SITES
-A DepthPerAlleleBySample
-A FisherStrand
-A InbreedingCoeff
-A MappingQuality
-A MappingQualityRankSumTest
-A QualByDepth
-A ReadPosRankSumTest
Created databases separately for each chromosome using GenomicsDBImport in GATK 4.1.2.0
Joint SNP calling using GenotypeGVCFs with the following arguments.
--include-non-variant
--max-alternate-alleles 3
--standard-min-confidence-threshold-for-calling 20
Each chromosome .vcf file was split into variants and invariants.
VQSR recalibration carried out separately on each chromosome using VariantRecalibrator in GATK 4.1.2.0 with the following arguments.
--resource:dbsnp,known=false,training=true,truth=true,prior=6.0
206sticklebacks_GATKvariants.SNP.filtered.vcf.bgz
-an QD
-an FS
-an MQRankSum
-an ReadPosRankSum
-mode SNP
--max-gaussians 4
Applied recalibration using ApplyRecalibration in GATK 4.1.2.0 using the following argument.
--truth-sensitivity-filter-level 99.0- Keep pure snps only (no indels)
- Keep biallelic snps only
- Keep only snps on unmasked RepeatMasker sites in reference genome
- Remove SNPs within 3 bases of an indel
- Keep snps that PASSed VQSR
Used SnpStats package in R 3.6.0 R Bioconductor 3.9 to generate SNP matrices for all SNPs passing the filters.
Dropped 42 specimens, retained 612 specimens that met criteria.
                                Site   N  Latitude
                      --------------  --  --------
1                      Big Sur River   17  36.2815
2              Elkhorn Slough (CA01)   31  36.8242
3                  Doran Park (CA02)   48  38.3087
4              Navarro River Estuary    2  39.1972
5               Big River-site1.32km    3  39.3032
6                Arcata Marsh (CA03)   47  40.8538
7             South Slough; Coos Bay   45  43.2892
8               Tillamook tidal gate   49  45.4753
9  Clam Bay. Manchester. Puget Sound    1  47.5714
10                       Puget Sound   40  47.9400
11                    Bamfield Inlet   11  48.8258
12                 Sarita (Bamfield)   39  48.8982
13             Little Campbell River   69  49.0130
14                        West Creek    1  49.1471
15                     Oyster Lagoon   10  49.6175
16                           Seyward    1  50.3833
17               Koeye River estuary   49  51.7744
18                   Fish Creek Pond   47  58.3301
19                  Mendenhall River    1  58.3604
20                          Auke Bay    4  58.3841
21                   Mud Lake marine   52  61.4975
22                     Rabbit Slough   45  61.5132
Fitted logistic regression to allele frequency at every SNP against latitude using glm() in R. Saved fitted intercept, slope, “pseudo-P” value from each fit (pseudo because river could not properly be included as a random effect).
Carried out a single randomization of latitude at each SNP, and refitted using glm() in R. Saved intercept, slope and pseudo-P value from randomization. The frequency distribution of slopes from the randomizations was used as the null distribution for tests of slope. Pseudo-P values from randomizations were used as the null distribution for pseudo-P.
SNPs were retained if significant at 99% level according to either slope or pseudo P.
Stickleback annotation file Gasterosteus_aculeatus.BROADS1.100.gtf.gz obtained at Ensembl. Chromosome names were modified to agree with those in the reference genome, gasAcu1.fa
A transcript database was made using makeTxDbFromGFF() in the GenomicFeatures package in R. SNPs were then located in the genome with the locateVariants() function in the VariantAnnotation package in R. Locations were simplified to “gene” (including introns and exons) and “intergenic” (including promoter sites upstream of genes). Nearest gene upstream and downstream of intergenic SNPs were also recorded.
External gene names for stickleback were obtained from Ensembl with getBM() in the biomaRt package in R and using the gconvert() function in the ggprofiler2 package in R (Ensembl v 102).
The numbers of significant SNPs in genes and intergenic regions were tallied using custom scripts in R. The counts are listed here: MarinePac.extremeGlmSnps0.01.SNPsByGene.csv.
Parallel evolution v1.0
Only stickleback SNPs located to genes were included in our parallel evolution analysis described below. Those located to intergenic regions were not used.
All stickleback genes containing at least 25 significant SNPs were retained (hereafter, “extreme genes”). Stickleback genes containing fewer than 25 significant SNPs were dropped.
Ensembl protein names corresponding to each extreme stickleback gene were obtained from Ensembl using the getBM() function in the biomaRt package in R.
Orthologous Chinook salmon proteins for all these stickleback proteins were obtained by Pooja Singh in Sam Yeaman’s lab (University of Calgary) using the OrthoFinder program, v 2.3.12. Her description is as follows.
I performed ortholog identification using protein sequences to detect homology between the 2 species, as protein sequences are more sensitive than nucleotide sequences for longer divergence times. I selected the longest isoform per gene, as multiple isoforms per gene will be misinterpreted as paralogs by the software. … [The] methods essentially implement an all versus all protein blast [using Diamond], followed by grouping of protein sequences into orthogroups. The orthogroup will be the unit of comparison for the convergence analysis. … OrthoFinder reconstructs gene trees [with DendroBLAST and fastree] to define orthogroups.
Chinook gene ID’s (“orthologous genes”) corresponding to the orthologous proteins were obtained from the Chinook annotation file.
The number of significant Chinook SNPs locating to each of the orthologous genes, and to the intergenic regions immediately upstream and downstream of each gene, were tallied.
Putatively adaptive SNPs v1.0
The orthologous Chinook genes were designated “significantly parallel” if they contained at least 10 significant SNPs within the region of the gene. A total of 183 chinook salmon genes met this criterion. These represent our sample of putatively adaptive genes.
The list of putatively adaptive genes is provided here: parallelChinookGenes.csv.
An explanation of the variables in this file are as follows:
seqnames: Name of chromosome or contig
start:
Position of first nucleotide of gene region
end: Position
of last nucleotide of gene region
width: Size of the gene
region (including introns and exons)
ID: NCBI gene ID (from
annotation file)
gene: NCBI gene name (from annotation
file)
proteins: Names and descriptions of orthologous
chinook proteins
Nsnps99: Number of significant SNPs
present in gene region
Nupstream99: Number of significant
SNPs in upstream intergenic region
Ndownstream99: Number of
significant SNPs in downstream intergenic region
NsnpsQ99:
Number of 99th quantile SNPs in gene region
NupstreamQ99:
Number of 99th quantile SNPs in upstream intergenic region
NdownstreamQ99: Number of 99th quantile SNPs in downstream
intergenic region
99th quantile SNPs are simply those SNPs having a slope or pseudo-P value falling in the upper 99th percentile of slopes or pseudo-P values. This is a more stringent criterion than those SNPs significant at the 0.01 level. Only 29 chinook genes orthologous to extreme stickleback genes had at least 10 SNPs meeting this criterion.
Significant Chinook SNPs were classified as “putative adaptive SNPs” if they were located within the gene region of putatively adaptive genes.
The list of putatively adaptive SNPs is provided here: chinookAdaptiveSNPs.csv.
An explanation of the variables in this file are as follows:
seqnames: Name of chromosome or contig
snp:
parallel chinook SNPs significant at the 0.01 level
position: Position on chromosome or contig
nGenotypes: Number of genotypes called
alleleFreq: Frequency of the ALT allele based on all called
genotypes
intercept.logit: Intercept of logistic regression
alleleFreq vs latitude
slope.logit: Slope of logistic
regression alleleFreq vs latitude
log10pseudoP: log10
pseudo-P value of logistic regression
© 2009-2024 Dolph Schluter