
I’ve been doing work on a stickleback GBS dataset and we’re trying to figure out how many samples we can cram into a single lane of illumina. I did some analyses which people may find useful. It’s unclear how applicable the recommendations are for sunflower which seems to have more problems than fish.
Take home message, with 25% less data you lose around 15% of the genotype calls, but up to 50% of the SNPs if you use a stringent coverage filter, due to how the lost data is distributed among loci and individuals.
We did 150 samples in the last lane and we can go up to 196 with our available barcodes. I looked at this a bit before but with the more stringent SNP calling I’ve implemented I thought it best to look again.
One method I’m working on now (suggested by Greg Baute) is taking the existing data, cutting off 25% of the reads and running the whole alignment and SNP calling protocol. This should approximate the amount of data we’d get per sample if we went up to 196. This analysis is at the bottom of the page.
I did a rarefaction curve, I’ve attached the new one and the old one. The old one is raw genotypes from GATK and the new one is filtered using a script from Sam and Chris to remove genotypes with poor quality or less than 5 reads. You can see they both follow the same sort of curve where you have more sites called with more reads. The high quality one, which removes poorly supported base calls, is lower and only a couple samples seem to have maxed out. We still see the difference between barcode plates which is either due to the barcodes or something else that went wrong during library prep.
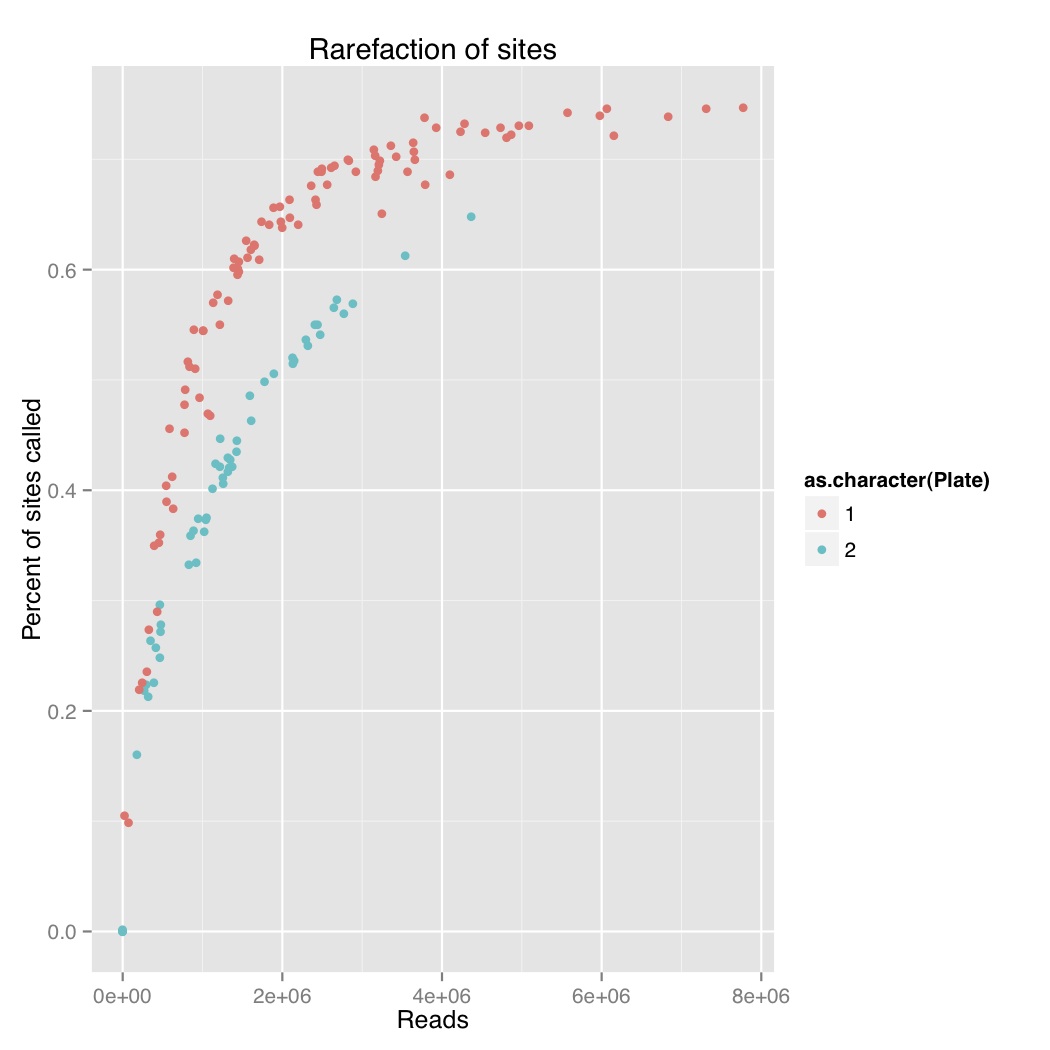
Reads versus percent of sites called for stickleback GBS with no filtering
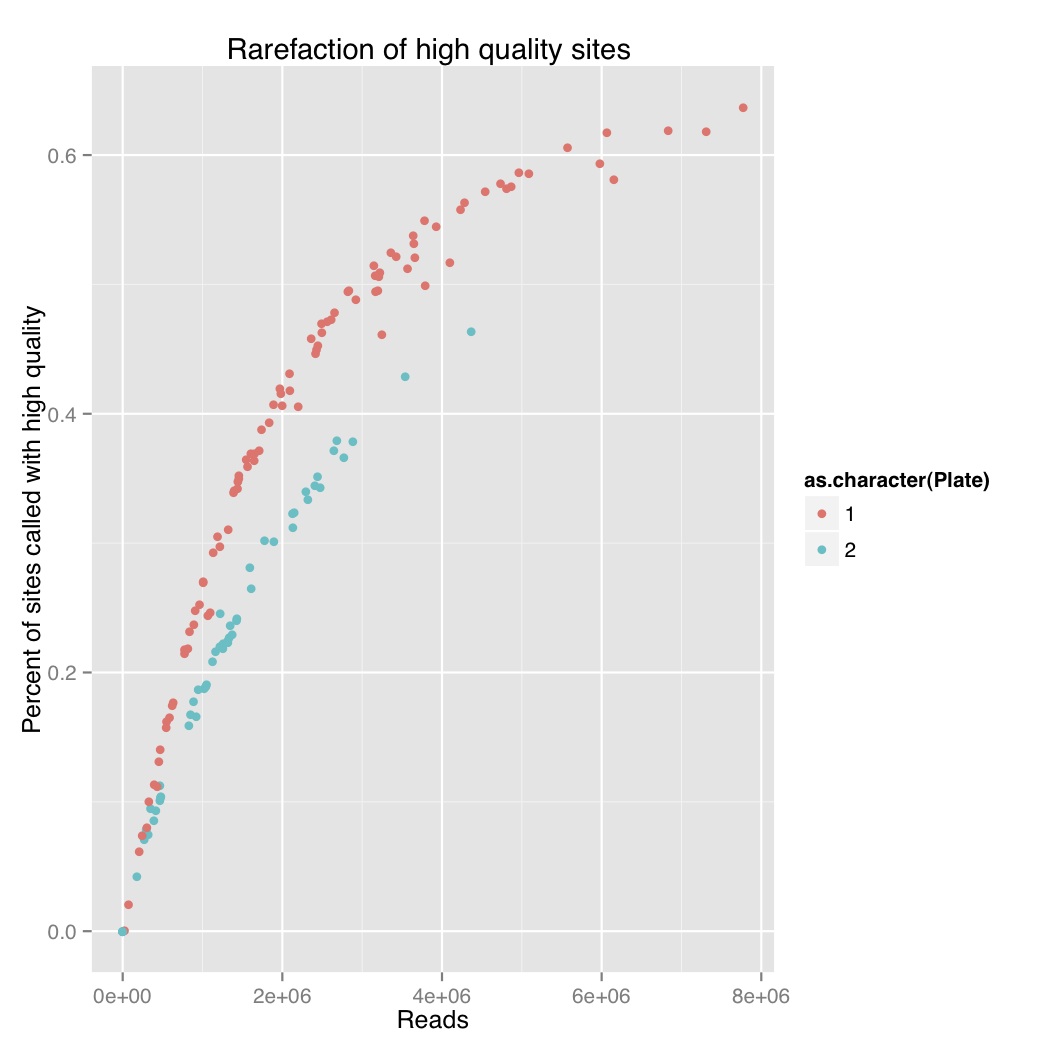
Reads versus percent of sites called for stickleback GBS with genotype quality filtering
I also went through the raw vcf file and pulled out the number of reads supporting each site for each individual. These are only sites that have a non-reference allele (it didn’t emit sites that were entirely invariant) and for the sake of this analysis, I’m accepting the GATK base calling when calculating the number of individuals called.
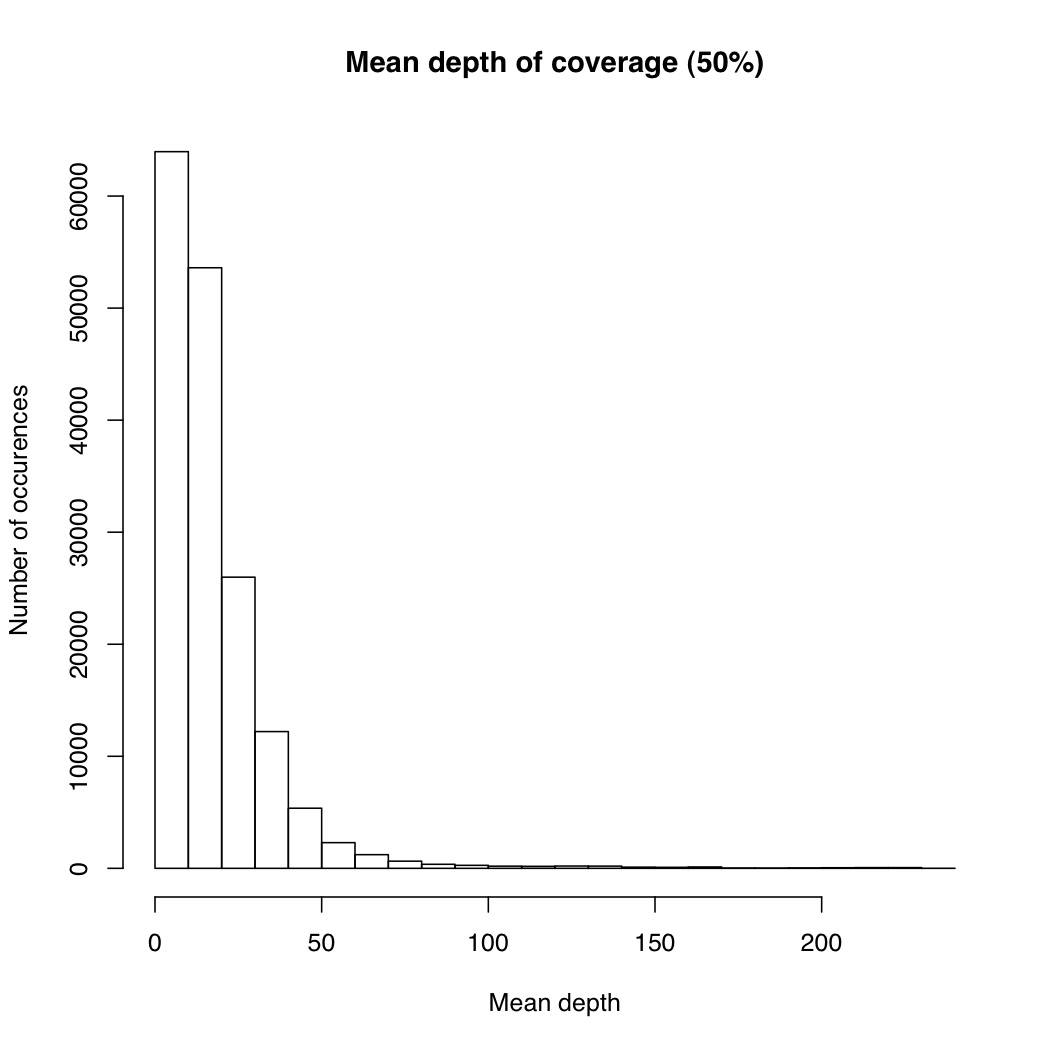
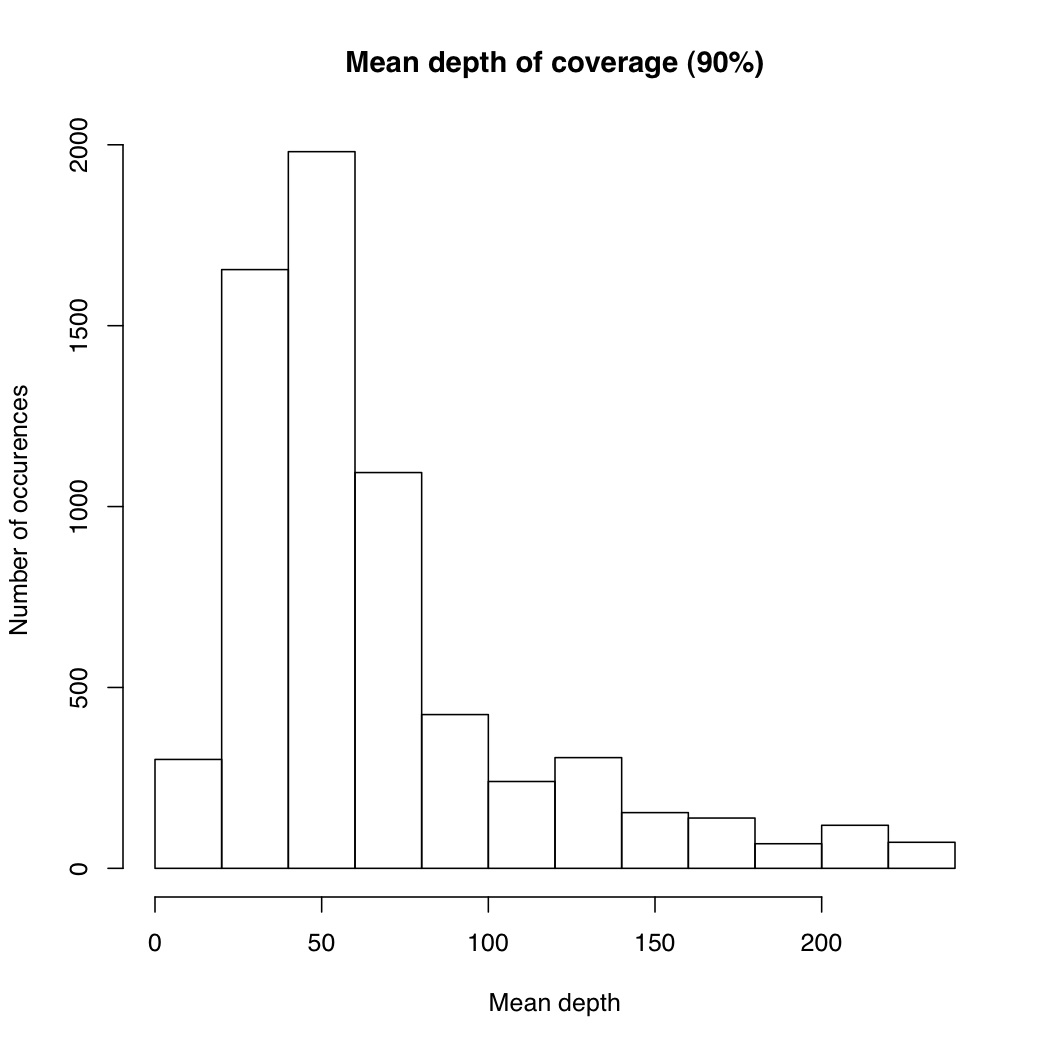
I’m not sure the best way to summarize this data. What I did do is look at all sites where atleast X% of individuals were called and then looked at the mean depth at that site. So for sites where most of the samples have data, how much data do they have each? I did it for 50%, 75% and 90% of samples covered (See graphs). The average coverage goes up with the minimum samples covered (because there are less zeros). The 90% of samples covered data roughly corresponds to most of the sites we will ultimately use, and it has an average coverage of 50X. That would suggest if you reduced the total number of reads by 25% you’d lose relatively few of these.

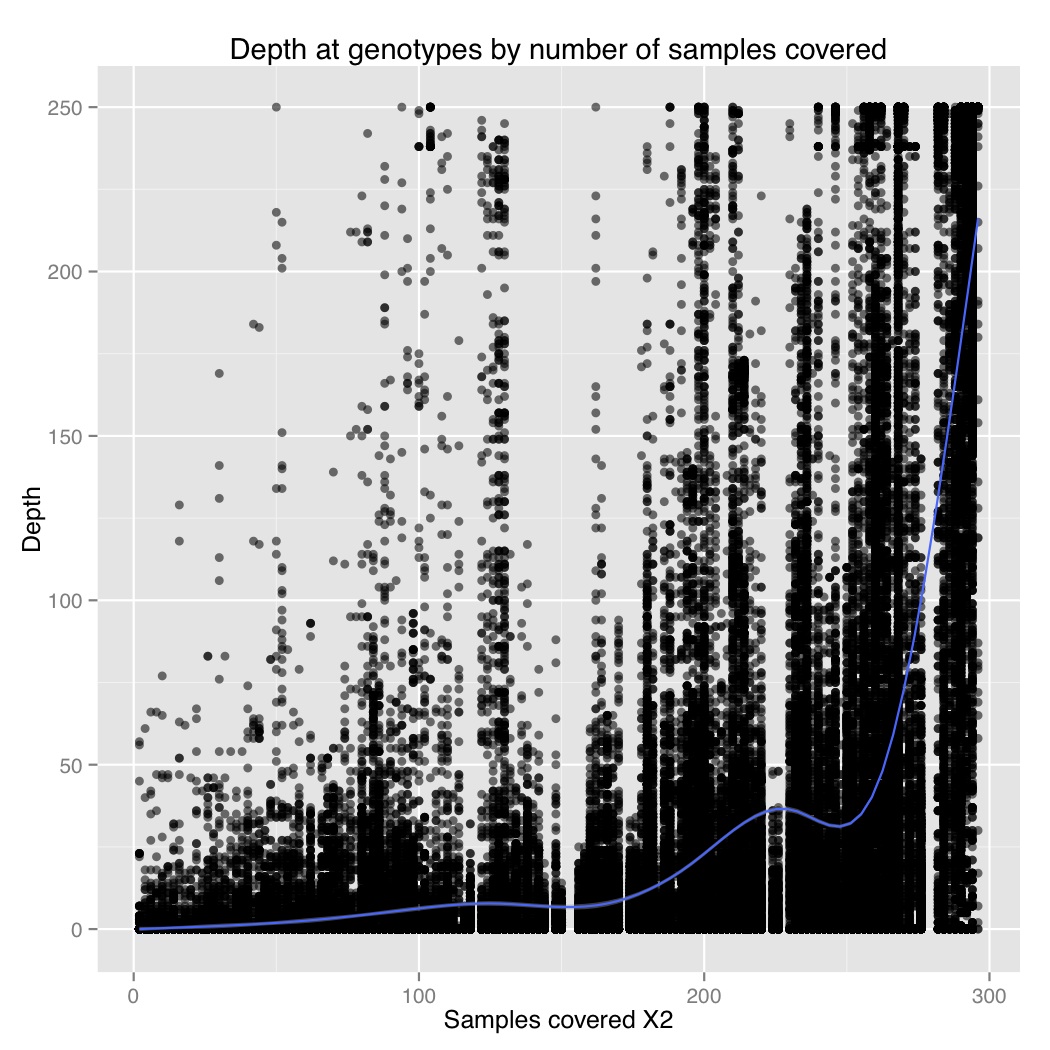
I also plotted number of samples covered by depth at a genotype for 1000 sites. From this we can see that there is a general positive correlation between number of samples covered and depth at those genotypes. So sites that were only sequenced in a few individuals were sequenced at low coverage, and sites that were sequenced in everyone were sequenced at high coverage. It suggests there are preferential portions of the genome where GBS works better, perhaps due to the chromatin.
Back to crunching the numbers, with 90% coverage cut off there are 6554 sites and 150 individuals with potentially 983,100 genotypes.
Genotypes with greater than 4 reads, which is our minimum quality cut off: 885,262 (90%)
If we consider an even 25% loss in coverage, the genotypes that will be lost are ones with depth of 5 to 8 roughly. The number of genotypes with greater than 9 reads: 819,617 (83%).
This corresponds to an 8% loss in genotypes when increasing to 196 samples.
I repeated that analysis with the 75% coverage dataset which would be a more inclusive sample. There are 83,075 sites and 150 individuals (12,461,250 possible genotypes).
Genotypes > 4 depth: 9,050,412 (72.6%)
Genotypes > 9 depth: 7,350,817 (59%)
This corresponds to an 19% loss in genotypes when increasing to 196 samples.
With this considered, it seems like if we increased to 196 samples, we would loss between 10-20% of the genotypes and they’d tend to be focused on sites where the number of samples covered is low (i.e. the mediocre sites get worse). If we’re adding more samples that are going to be used in the same analysis, it seems worthwhile to add more. Looking at the low end, 72.6% of 150 samples is =108.9 vs 59% of 196 samples = 115.6.
If you’re adding samples for a different analysis to save money it’s harder to say whether it’s worthwhile. If we had ~15% less sites it’s probably still usable for most applications but not ideal for genome scans.
EDIT: May 29
I redid the snp calling using 75% of the original data. Things look less good than I predicted.
| samples covered | Full dataset | 75% dataset | Percent remaining |
| 100% | 17 | 15 | 0.882352941 |
| 90% | 2077 | 1003 | 0.48290804 |
| 80% | 10687 | 6154 | 0.575839805 |
| 70% | 24585 | 16491 | 0.670774863 |
| 60% | 41184 | 29892 | 0.725815851 |
It seems like you lose up to half of your SNPs, more than the 10-20% I predicted. I think its a matter of how the lost genotypes are distributed among the loci.
Imagine you had 100 individuals and 1000 loci with exactly 90% of individuals covered. If you lost 1000 genotypes, which is only 1% of the total, you could lower the % covered to 89% for each loci, putting it below a threshold and losing it entirely. This would be even more likely if low depth genotypes were clustered in a few individuals (which they are because of variation in number of reads per barcode).
This pans out when I actually look at the number of calls per sample between the dataset. Each individual in the reduced dataset has around 10,000 less genotype calls. This corresponds to a drop of around 16% on average. So, we aren’t actually losing that much data but with the cut offs for number of individuals covered it makes it worse.