For more on maps, see Dylan’s previous post. The information in this post is also on my own blog.
Here’s what I made, read below for how.
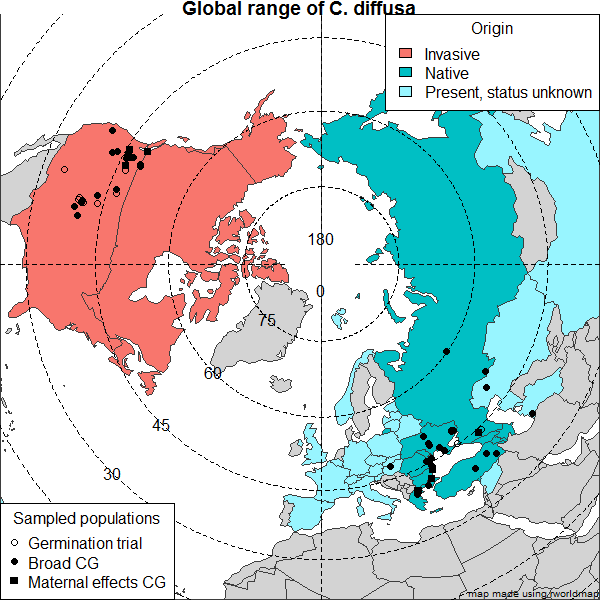
Range and collection map of Centaurea diffusa
If all you need to map is part of North America in R, wow are you set! You can do so many things, using just the maps that are natively included in the R packages that Kim and Dylan discuss (“maps”, “maptools”, “mapdata”, “scales”, “mapproj”, and “RgoogleMaps”). But what if you need to map a large area? Shouldn’t the area of a continent on your map be somehow related to reality? Then you need a projection.There are even some projection options available in these packages, and if you are mapping a small enough area, maybe you don’t even need to worry about projections. Projections can be tricky.
And if you happen to want to make a projected map of Eurasia that doesn’t include relics like Czechslovakia and the USSR, then things get a bit trickier. Because who would want to do that, silly invasion biologist, studying GLOBAL PROBLEMS? So with encouragement from Dylan Burge and invaluable help from Andy South, the creator of the rworldmap package, here’s what I came up with. Read more about this package here: rworldmap write-up, and some worked examples.
Because the species I am working on, Centaurea diffusa, could now be considered holarctic, including it’s invaded range, I need a map of the entire northern hemisphere. So I settled on a Lambert azimuthal equal area projection, with the North Pole in the center, like you were looking straight down on the globe. I also wanted to color-code countries to indicate the species range, and plot collection points. I’ve included my complete code and comments as a gist on GitHub, and uploaded it here: ModernMapEurasia