To see Demos on how to make this graphs, click on the links below:
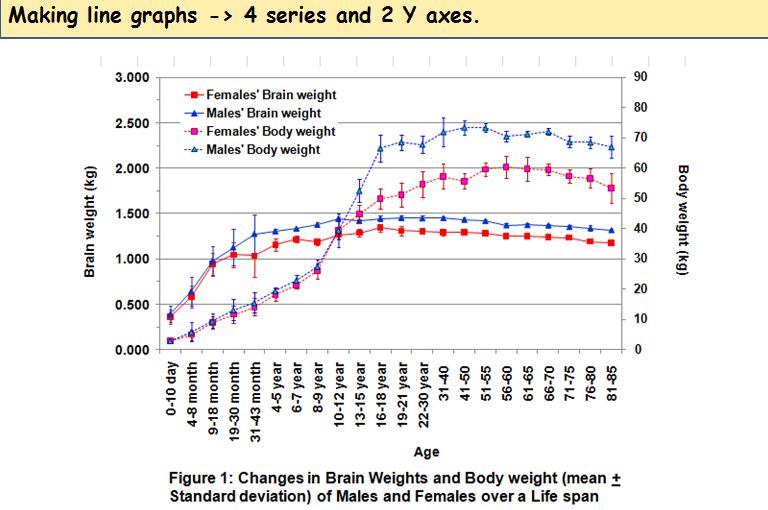
| Strategy: we are going to plot the body weights inside the graph we just finished doing. | http://www.youtube.com/watch?v=JYm-OA-BknI | Movie MP4(HD) |
| Plot the average body weight of males and females (learn also how to rename a series) | http://www.youtube.com/watch?v=DyvOlIgNrB4 | Movie MP4(HD) |
| Create a second Y axis and link the males and females body weight series to this second Y axis | http://www.youtube.com/watch?v=SNzdKl97n_4 | Movie MP4(HD) |
| Write and rotate the title of the secondary Y axis | http://www.youtube.com/watch?v=tuabFrVg6iw | Movie MP4(HD) |
| Re-scale the secondary Y axis | http://www.youtube.com/watch?v=tvYb6iRtHO0 | Movie MP4(HD) |
| Color code the data point and the line of the males and females body weight series | http://www.youtube.com/watch?v=NJkrHW2eE74 | Movie MP4(HD) |
| Plot their standard deviations as error bars and color code the error bars | http://www.youtube.com/watch?v=gwGoYo-3wUQ | Movie MP4(HD) |
| Modify the title of the graph | http://www.youtube.com/watch?v=O0PzPru_2uI | Movie MP4(HD) |
| Final touch | http://www.youtube.com/watch?v=s_uwMsX5oHI | Movie MP4(HD) |