To see Demos on how to make this graphs, click on the links below:
| Make sure that the categories in both datasets are identical | http://www.youtube.com/watch?v=7QeUJ_xCPTw | Movie MP4(HD) |
| Insert a Line graph | http://www.youtube.com/watch?v=viBreUwsOo4 | Movie MP4(HD) |
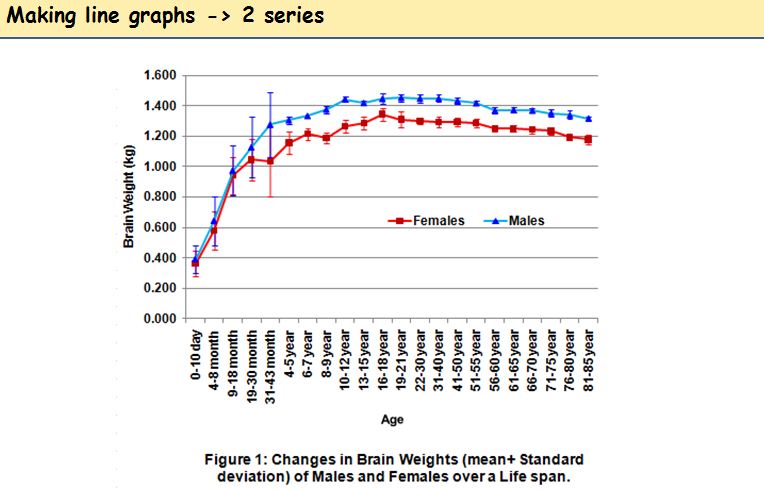
| Plot the average brain weights of males & females and label the categories | http://www.youtube.com/watch?v=XLFUHj_xcrc | Movie MP4(HD) |
| Write the titles of the axises and the title of the graph | http://www.youtube.com/watch?v=8sBjg70qvZ0 | Movie MP4(HD) |
| Resize the graph, change fonts | http://www.youtube.com/watch?v=lSbYuqLYbQw | Movie MP4(HD) |
| Color code the data points and the lines of the 2 series Males & Females | http://www.youtube.com/watch?v=_kvVaaZDH74 | Movie MP4(HD) |
| Plot the standard deviation as error bars | http://www.youtube.com/watch?v=D-ijTDPPs-s | Movie MP4(HD) |
| Color code the error bars | http://www.youtube.com/watch?v=L5cjWAvPw1s | Movie MP4(HD) |
| Remove the border around the graph | http://www.youtube.com/watch?v=eon1K2zCejA | Movie MP4(HD) |