NSERC funding by gender
Success rates are similar, but women still get less
Judith Myers UBC
NSERC has over the years provided data on request for the Discovery Grant Program for Ecology and Evolution broken down by both gender and different categories of applicants, eg. established, new first renewals etc. In 2008, I summarized these data for presentation at the Canadian Coalition of Women in Science, Engineering, Trades and Technology (CCWESTT). This can be found as “NSERC Discovery Grant Statistics for males and females 2002 – 2008 at http://ww.ccwestt.org/Home/tabid/36/Default.aspx. That analysis showed a consistent trend for women to receive smaller grants than men with the exception of new applicants in 2007 and 2008 for which grants for women were larger.
Here, I analyze the NSERC data from 2009 and 2013. I show that success rates for grant applications are similar between men and women; however, the trend for women to receive lower grant funding on average continues.
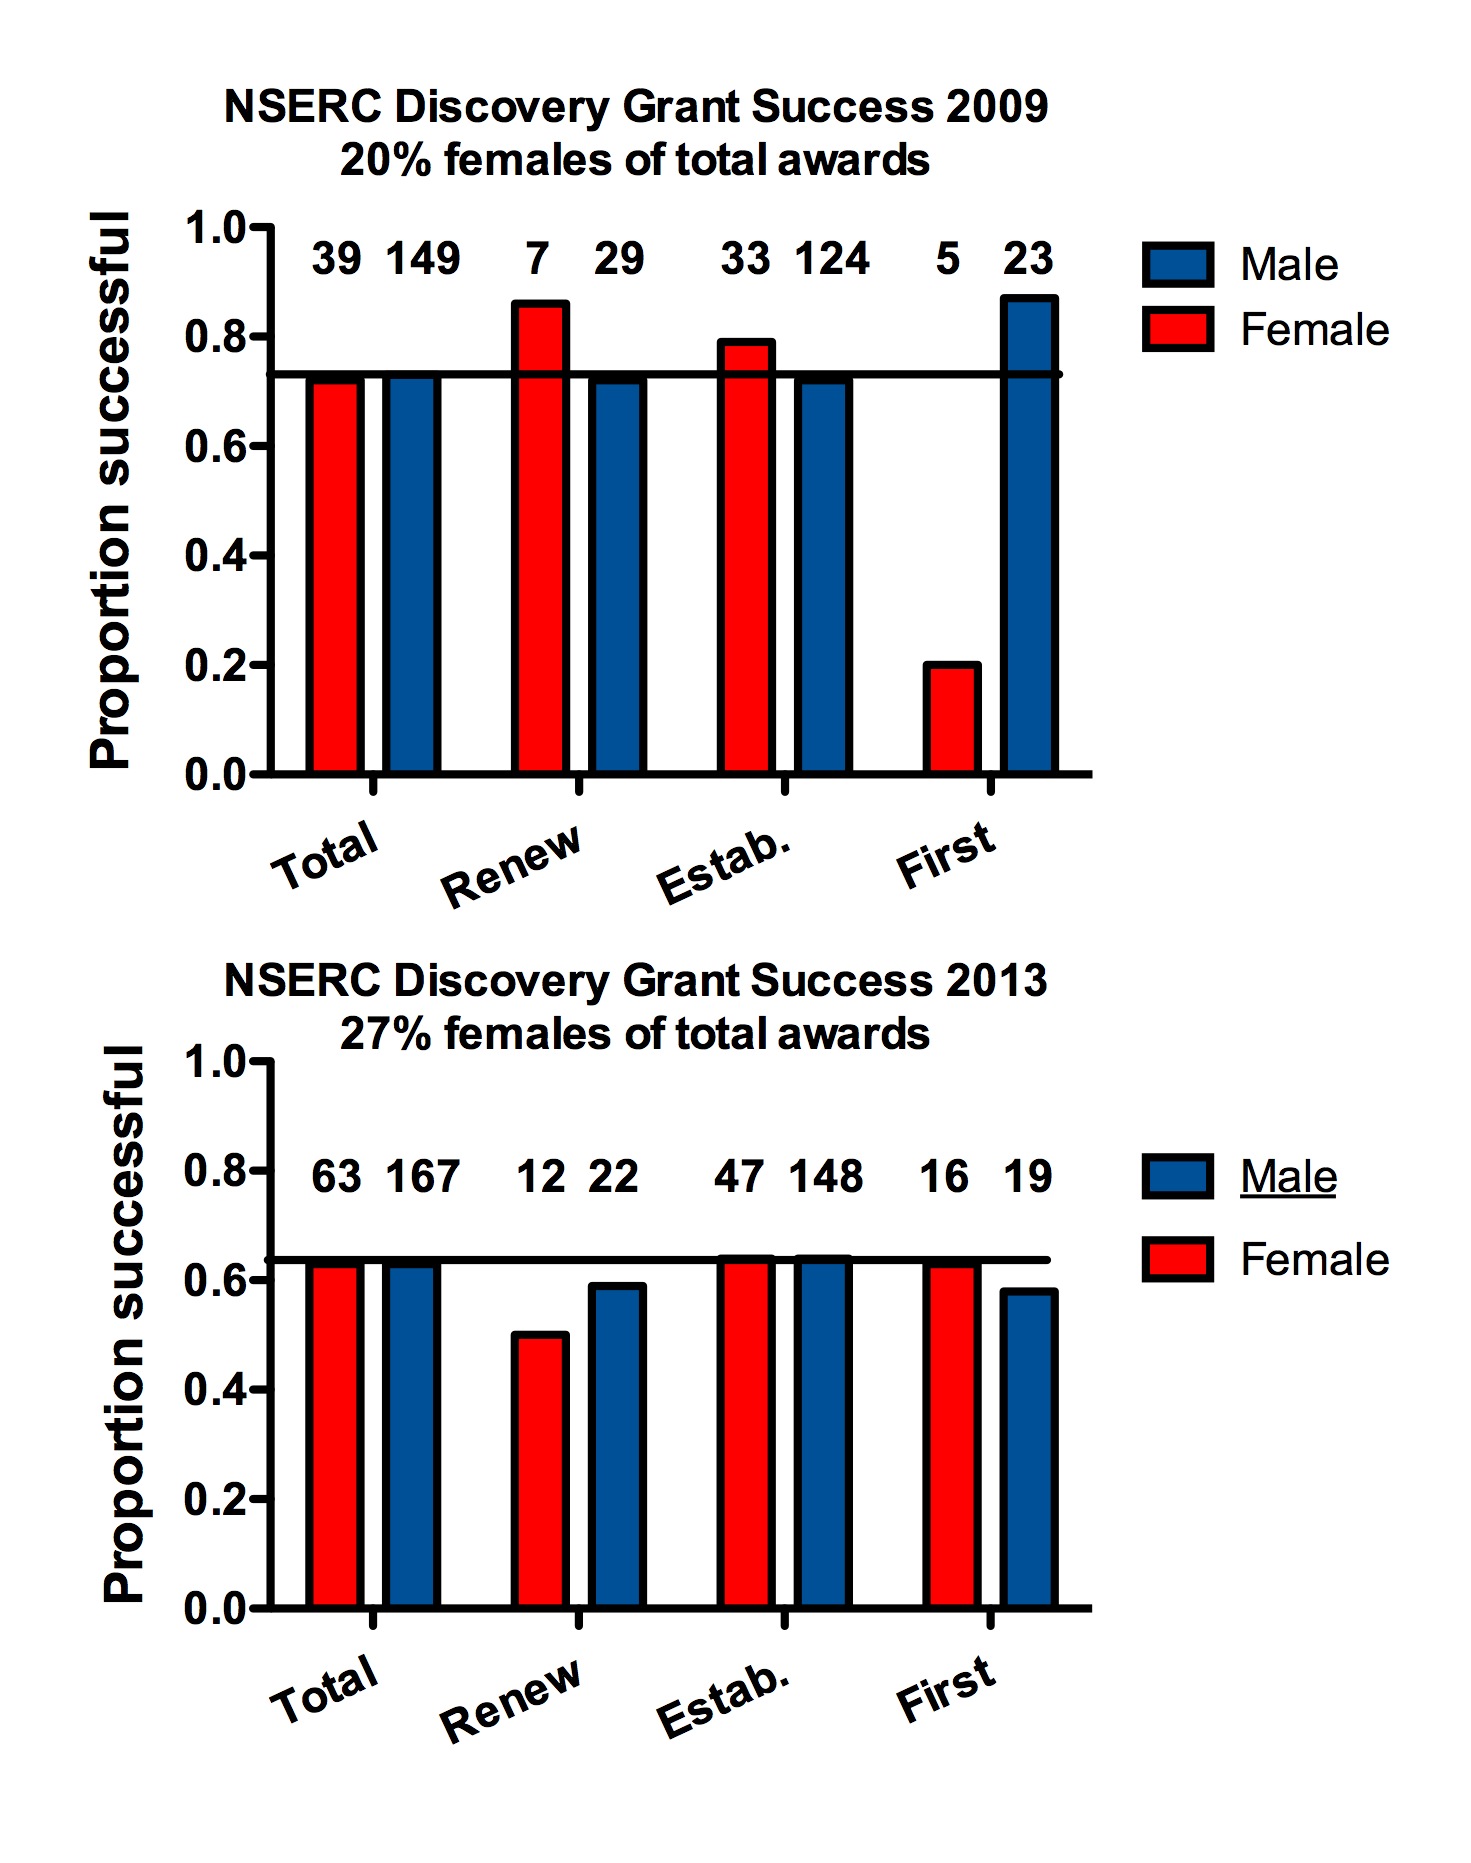
Figure 1. Proportion applicants successful in 2009 and 2013 competitions. Numbers of applicants are given in the legend. “Renewal” is first time renewal and “first” includes those applying for the first time and applicants that were previously unsuccessful in their first attempt. Horizontal lines indicate overall average success rate, 73% in 2009 and 63% in 2013. Number of applicants is at the top of the bar.
Figure 1 shows that the overall success rate in 2013 is approximately 10% lower than in 2009, the successes of males and females are similar, and the success rate across categories is similar although first renewal success is lower and is lowest for females. Given the importance of this stage for the establishment of the future careers of these applicants this trend is of concern.
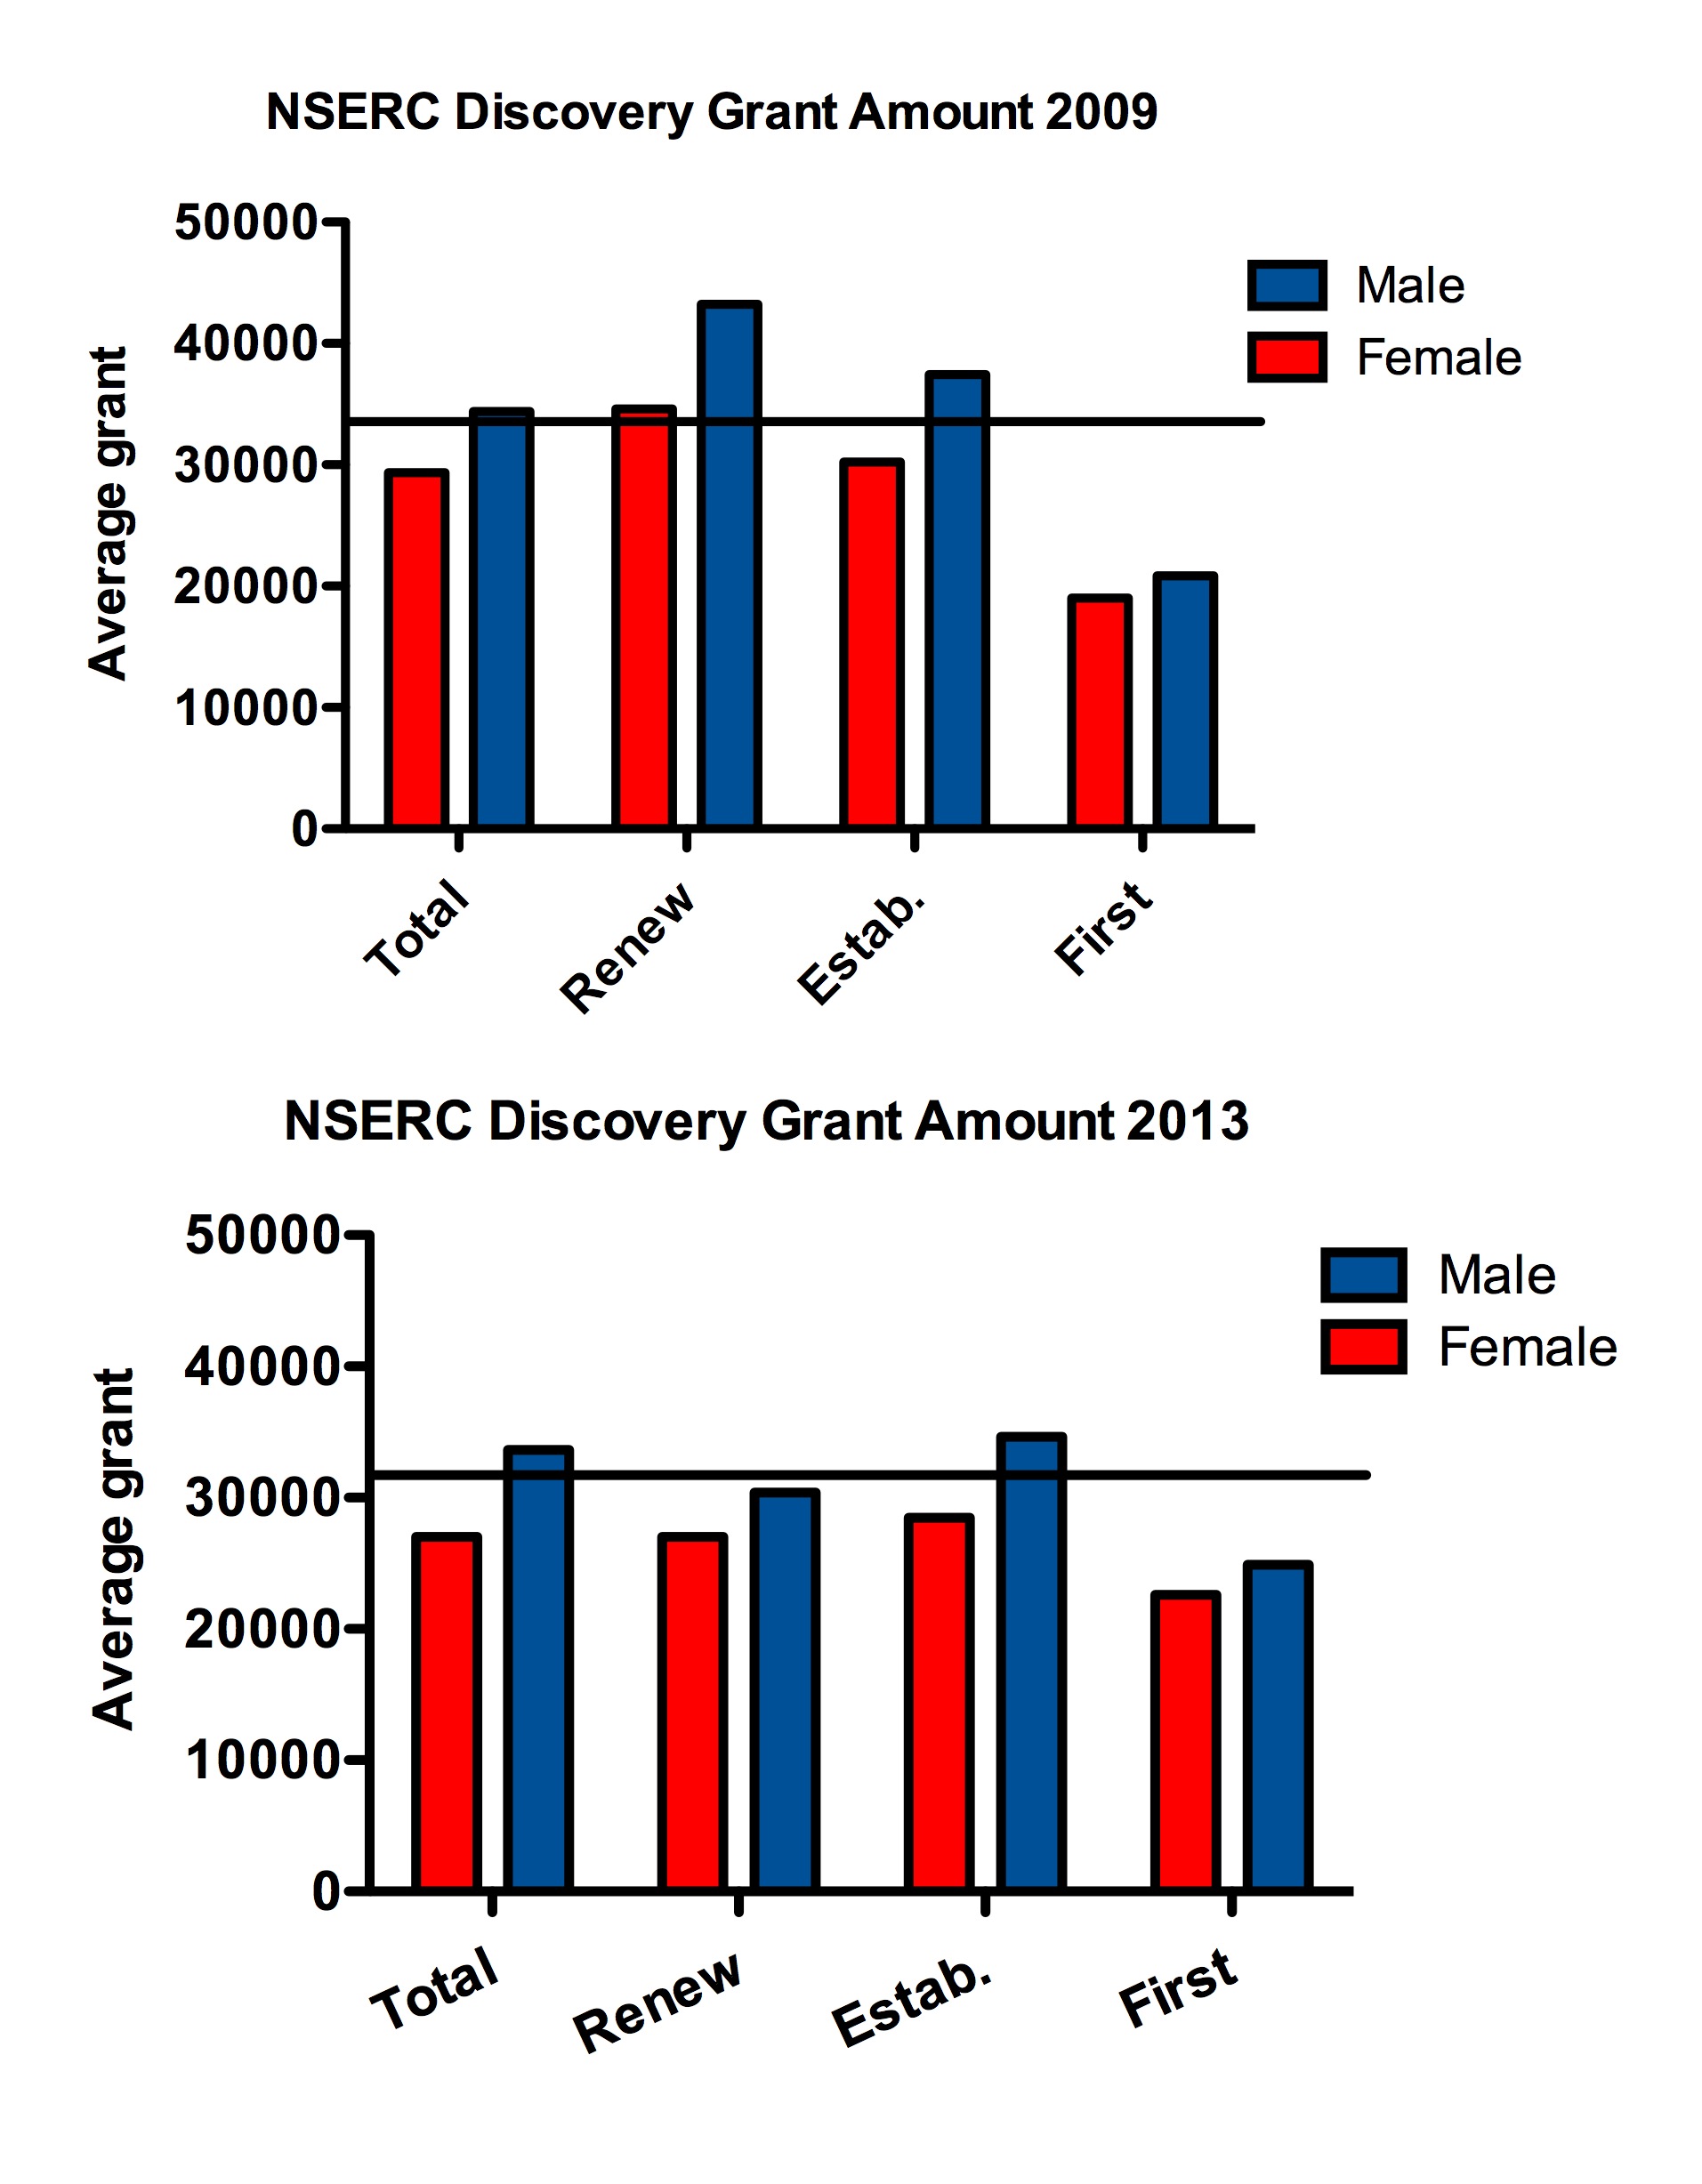
Figure 2. Average grants of different categories of applicants for NSERC Discovery Grants in 2009 and 2013. The horizontal line indicates the overall average grants grant size, $33 351 (grants $5028 less for females than males) in 2009 and $31 828 ($6650 less for females than males) in 2013.
Figure 2 shows that the trend seen in earlier data continues with grants of males being larger than those of females by a substantial amount. A factor here is that there are no female high fliers who have substantially larger grants than the average, and overall median grants are about the same for males and females. I have not taken accelerator grants into consideration here.
Given that females are on average receiving approximately $6500 less than their male colleagues, it would be interesting to know how this is translated into productivity measured as the number of publications in one year. For an indication of how publications relate to grant sizes, I selected individuals from the NSERC results for 2013 taking from a range of grant sizes but including those with the largest grants and a sampling from the lower grant sizes. I then used Web of Science to determine the number of publications for the year 2012-2013 for each chosen individual.
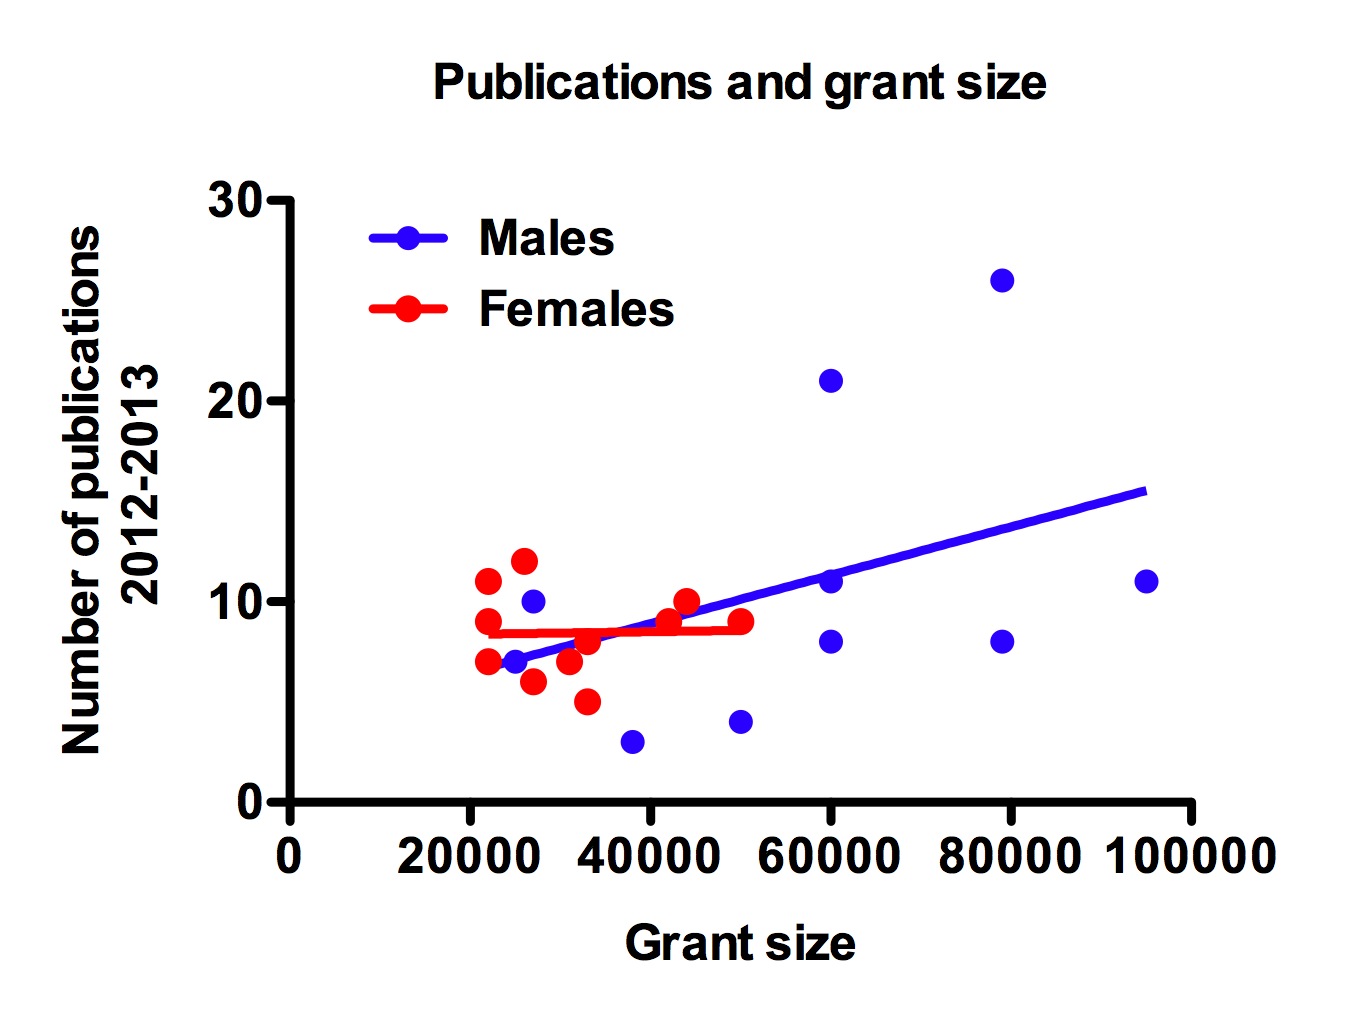
Figure 3. Size of grant awarded in 2013 and number of publications in 2012-2013 for an arbitrary sample of grantees. Neither relationship is significant, but that for males is influenced by the high publication number for two of the male “high fliers”.
The lack of relationship between yearly publication rates and grant size shows that productivity does not relate strongly to funding success. No female received a grant of more than $50 000 in 2013 so the range of the data is less for them. For males, high publication numbers for two “high fliers” cause a weak upward trend in the relationship of publications to funding, but average publication numbers for four “high fliers” pulls this relationship down. For these selected data the average number of publications for males was 10.5 and for females 9.1. Removing the data for “high fliers” in the male data sets results in a slightly higher grant size for males than for females but only 7 publications on average for males compared to 9 for females for similar funding levels. Although this is a small and selected data set, it likely reflects the overall pattern for little relationship between grant size and publication numbers. Similarly Lortie et al. 2012 (Oikos 121: 1005–1008) found that for the mostly highly-funded North American ecologists and environmental scientists, citations per paper were not related to increased levels of funding although for NSERC funded researchers there was a weak relationship. Fortin and Currie (2013) found that the number of papers, highest times cited, and number of high impact articles were only weakly related to NSERC funding levels for Animal Biology, Chemistry and Ecology and Evolution (PLOS ONE, DOI: 10.1371). Missing from these analyses are the data for individuals who receive no funding. Thus the reduced proportion of successful renewals in the current funding environment, and the slightly reduced success of first time renewals are not reflected in these evaluations of research productivity. A recent study of global patterns of publications and citations shows that women publish less than men particularly in areas in which research is expensive, they are less likely to participate in international collaborations and are less likely to be first or last authors on papers (Larivière et al. 2013. Nature 504:211 – 213). There are many factors involved here.
We do not have data on HQP numbers, a metric that is heavily weighted in the NSERC Discovery Grant evaluation. It is likely that the reduced funding level for females results in fewer HQP for them and this could have a strong impact on average funding from NSERC and publication numbers in the future.
In conclusion the new system of Discovery Grant evaluation appears to result in more similar levels of funding across categories but does not remove the bias towards larger grants on average for males. The impact on research productivity of the 37% of applicants that receive no funding as a result of the lower success rate is not easy to evaluate, but data do not support the hypothesis that higher funding for fewer individuals increases Canada’s research productivity.
data do not support the hypothesis that higher funding for fewer individuals increases Canada’s research productivity
Judy – I do not want to discourage you from kindly sharing your great wisdom but this is an unsupported claim that is regularly advanced by Canadian academics to support their disproportionately large amount of funding as compared with their international colleagues. My re-analysis of the data (I have pulled points off your Figure 3 but it would increase transparency if you made these data publicly available please), shows no basis for your claim that higher funding for fewer individuals would not increase Canada’s research productivity.
In fact, in males, there is a STRONG positive association between funding and productivity. This does not seem to be influenced by the two “high fliers” and this would have been apparent if the data were plotted on a log-scale. Here is the result of my analysis with the R code so that you can reproduce it yourself.
summary(glm(outputs ~ funding, family = “poisson”))
Call:
glm(formula = outputs ~ funding, family = “poisson”)
Deviance Residuals:
Min 1Q Median 3Q Max
-2.1077 -1.6434 -0.4606 0.7485 2.9326
Coefficients:
Estimate Std. Error z value Pr(>|z|)
(Intercept) 1.638e+00 2.964e-01 5.527 3.26e-08 ***
funding 1.246e-05 4.437e-06 2.808 0.00498 **
—
Signif. codes: 0 ‘***’ 0.001 ‘**’ 0.01 ‘*’ 0.05 ‘.’ 0.1 ‘ ’ 1
(Dispersion parameter for poisson family taken to be 1)
Null deviance: 39.567 on 9 degrees of freedom
Residual deviance: 31.572 on 8 degrees of freedom
AIC: 76.165
Number of Fisher Scoring iterations: 4
It is disappointing that this “error” made it into the Jan 2014 Bulletin of the Canadian Society for Ecology & Evolution. Can you please correct this in the upcoming Bulletin?
The Canadian Society for Ecology & Evolution plays an important role in promoting ecology and evolution in Canada but its credibility will be questioned by seemingly politicized claims that do not interpret data objectively.
PS – Here are the data I used for the analysis presented above. Feel free to correct them.
outputs funding
1 60000 21
2 79000 26
3 95000 11
4 79000 8
5 60000 11
6 60000 8
7 27000 10
8 25000 7
9 50000 4
10 38000 3
The regression of publications to dollars on nontransformed data was not significant for males, females or combined and I do not see a need to transform the data. The figure shows the large amount of variation among individuals. Clearly a more complete data set is required which I am working on. The data for males are below.
60000. 11.
79000. 8.
79000. 26.
50000. 9.
60000. 8.
22000. 9.
25000. 7.
27000. 10.
42000. 9.
50000. 4.
38000. 3.
60000. 21.
95000. 11.
You are correct that the number of papers is count data, and that strictly speaking linear regression alone is not necessarily appropriate. However, using a log transformation to normalize the paper count data (Shapiro-Wilk: W = 0.9245, p-value = 0.2886) still results in a non-significant relationship using a linear model (p=0.1657).
The glm model that you ran is in fact not appropriate due to the currently very small sample size (see chapter in Crawley 2007, http://www3.imperial.ac.uk/pls/portallive/docs/1/1171926.PDF). I note from your analysis the deviance ratio is high (~3) which probably reflects the strong impact of the two males with larger grants and high numbers of publications. While your analysis might appear to indicate a relationship, Crawley would say that with a sample size of substantially less than 30 data points, hypothesis testing using glm with a poisson distribution could be misleading. I don’t know why it is so different from linear regression with transformation and from from the apparent scatter in the data.
I think that careful inspection of the data themselves shows that there is no strong relationship. Given that there are only 13 data points that were selected to obtain a range of grant sizes, and that two of these points have an apparent impact on the relationship, the only way to have confidence in any relationship is to collect and analyze additional data. I hope to do in the coming months.
Given these reasons I do not feel a correction is necessary in the CSEE Newsletter.
For me, the most interesting question arising from these data is why few women get large grants. I think the answer to this question lies beyond the scope of this analysis, even with a larger sample size. It can only be investigated by looking at why women tend to have different career trajectories than men in our current academic system.
Thank you for posting the data. I do not understand why there are 13 points here but 10 in your plot.
As for your comment: I do not see a need to transform the data
Oh dear me. The data MUST be transformed. Your response variable is a count. It is not a normally distributed, continuous variable like how you have treated it. This is well appreciated and is reducing your power to detect what is an obvious trend if you plot the data.
Even if you don’t want to treat the number of papers published like a count, the data are not normally-distributed:
shapiro.test(outputs)
Shapiro-Wilk normality test
data: outputs
W = 0.8044, p-value = 0.007692
And you get the same answer with the larger dataset:
> summary(glm(outputs ~ funding, family = “poisson”))
Call:
glm(formula = outputs ~ funding, family = “poisson”)
Deviance Residuals:
Min 1Q Median 3Q Max
-2.2084 -1.3936 -0.1595 0.6513 2.9783
Coefficients:
Estimate Std. Error z value Pr(>|z|)
(Intercept) 1.725e+00 2.420e-01 7.129 1.01e-12 ***
funding 1.121e-05 3.888e-06 2.884 0.00393 **
—
Signif. codes: 0 ‘***’ 0.001 ‘**’ 0.01 ‘*’ 0.05 ‘.’ 0.1 ‘ ’ 1
(Dispersion parameter for poisson family taken to be 1)
Null deviance: 40.391 on 12 degrees of freedom
Residual deviance: 32.156 on 11 degrees of freedom
AIC: 88.91
Number of Fisher Scoring iterations: 4
I think your CSEE Bulletin that presents this analysis should be corrected or my comments published in the next issue. I also think that the more interesting question we should be asking is why more money is not benefiting women, when it clearly raises the productivity of men?