Monthly Archives: December 2017

On the Tasks of Retirement

The end of another year in retirement and time to clean up the office. So this week I recycled 15,000 reprints – my personal library of scientific papers. I would guess that many young scientists would wonder why anyone would have 15,000 paper reprints when you could have all that on a small memory stick. Hence this blog.

Rule #1 of science: read the literature. In 1957 when I began graduate studies there were perhaps 6 journals that you had to read to keep up in terrestrial ecology. Most of them came out 3 or 4 times a year, and if you could not afford to have a personal copy of the paper either by buying the journal or later by xeroxing, you wrote to authors to ask them to post a copy of their paper to you – a reprint. The university even printed special postcards to request reprints with your name and address for the return mail. So scientists gathered paper copies of important papers. Then it became necessary to catalog them, and the simplest thing was to type the title and reference on a 3 by 5-inch card and put them in categories in a file cabinet. All of this will be incomprehensible to modern scientists.

A corollary of this old-style approach to science was that when you published, you had to purchase paper copies of reprints of your own papers. When someone got interested in your research, you would get reprint requests and then had to post them around the world. All this cost money and moreover you had to guess how popular your paper might be in future. The journal usually gave you 25 or 50 free reprints when you published a paper but if you thought you’d need more then you had to purchase them in advance. The first xerox machines were not commercially available until 1959. Xeroxing was quite expensive even when many different types of copying machines started to become available in the late 1960s. But it was always cheaper to buy a reprint when your paper was printed by a journal that it was to xerox a copy of the paper at a later date.

Meanwhile scientists had to write papers and textbooks, so the sorting of references became a major chore for all writers. In 1988 Endnote was first released as a software program that could incorporate references and allow one to sort and print them via a computer, so we were off and running, converting all the 3×5 cards into electronic format. One could then generate a bibliography in a short time and look up forgotten references by author or title or keywords. Through the 1990s the computer world progressed rapidly to approximate what you see today, with computer searches of the literature, and ultimately the ability to download a copy of a PDF of a scientific paper without even telling the author.

But there were two missing elements. All the pre-2000 literature was still piled on Library shelves, and at least in ecology is it possible that some literature published before 2000 might be worth reading. JSTOR (= Journal Storage) came to the rescue in 1995 and began to scan and compile electronic documents of much of this old literature, so even much of the earlier literature became readily available by the early 2000s. Currently there are about 1900 journals in most scientific disciplines that are available in JSTOR. Since by the late 1990s the volume of the scientific literature was doubling about every 7 years, the electronic world saved all of us from yet more paper copies of important papers.

What was missing still were many government and foundation documents, reviews of programs that were never published in the formal literature, now called the ‘grey literature’. Some of these are lost unless governments scan them and make them available. The result of any loss of this grey literature is that studies are sometimes repeated needlessly and money is wasted.

About 2.5 million scientific papers are published every year at the present time (http://www.cdnsciencepub.com/blog/21st-century-science-overload.aspx ) and the consequence of this explosion must be that each of us has to concentrate on a smaller and smaller area of science. What this means for instructors and textbook writers who must synthesize these new contributions is difficult to guess. We need more critical syntheses, but these kinds of papers are not welcomed by those that distribute our research funds so that young scientists feel they should not get caught up in writing an extensive review, however important that is for our science.

In contrast to my feeling of being overwhelmed at the present time, Fanelli and Larivière (2016) concluded that the publication rate of individuals has not changed in the last 100 years. Like most meta-analyses this one is suspicious in arguing against the simple observation in ecology that everyone seems to publish from their thesis many small papers rather than one synthetic one. Anyone who has served on a search committee for university or government jobs in the last 30 years would attest to the fact that the number of publications expected now for new graduates has become quite ridiculous. When I started my postdoc in 1962 I had one published paper, and for my first university job in 1964 this had increased to 3. There were at that time many job opportunities for anyone in my position with a total of 2 or 3 publications. To complicate things, Steen et al. (2013) have suggested that the number of retracted papers in science has been increasing at a faster rate than the number of publications. Whether again this applies to ecology papers is far from clear because the problem in ecology is typically that the methods or experimental design are inadequate rather than fraudulent.

If there is a simple message here, it is that the literature and the potential access to it is changing rapidly and young scientists need to be ready for this. Yet progress in ecology is not a simple metric of counts of papers or even citations. Quality trumps quantity.

Fanelli, D., and Larivière, V. 2016. Researchers’ individual publication rate has not increased in a century. PLoS ONE 11(3): e0149504. doi: 10.1371/journal.pone.0149504.

Steen, R.G., Casadevall, A., and Fang, F.C. 2013. Why has the number of scientific retractions increased?  PLoS ONE 8(7): e68397. doi: 10.1371/journal.pone.0068397.
 

On Politics and the Environment

This is a short story of a very local event that illustrates far too well the improvements we have to seek in our political systems. The British Columbia government has just approved the continuation of construction of the Site C dam on the Peace River in Northern British Columbia. The project was started in 2015 by the previous Liberal (conservative) government with an $8 billion price tag and with no (yes NO) formal studies of the economic, geological or environmental consequences of the dam, and in complete opposition by most of the First Nations people on whose traditional land the dam would be built. Fast forward 2 years, a moderate left-wing government takes over from the conservatives and the decision is now in their hands: do they carry on with the project, $2 billion having been spent already, or stop it with an additional $1-2 billion in costs to undo the damage to the valley from work already carried out? 2000 temporary construction jobs in the balance, the government in general pro-union and pro the working person rather than the 1%. They decided to proceed with the dam.

To the government’s credit it asked the Utilities Commission to prepare an economic analysis of the project in a very short time, but to make it simpler (?) did not allow the Commission to consider in its report environmental damage, climate change implications, greenhouse gas emissions, First Nations rights, or the loss of good agricultural land. Alas, that pretty well leaves out most things an ecologist would worry about. The economic analysis was sitting on the fence mostly because the question of the final cost of Site C is an unknown. It was estimated to be $8 billion, but already a few days after the government’s decision it is $10.5 billion, all to be paid by the taxpayer. If it is a typical large dam, the final overall cost will range between $16 to $20 billion when the dam is operational in 2024. The best news article I have seen on the Site C decision is this one by Andrew Nikiforuk:

https://thetyee.ca/Opinion/2017/12/12/Pathology-Site-C/

Ansar et al. (2014) did a statistical analysis of 245 large dams built since 1934 and found that on average actual costs for large dams were about twice estimated costs, and that there was a tendency for larger dams to have even higher than average final costs. There has been little study for Site C of the effects of the proposed dam on fish in the river (Cooper et al. 2017) and no discussion of potential greenhouse gas emissions (methane) released as a result of a dam at Site C (DelSontro et al. 2016). The most disturbing comment on this decision to proceed with Site C was made by the Premier of B.C. who stated that if they had stopped construction of the dam, they would have to spend a lot of money “for nothing” meaning that restoring the site, partially restoring the forested parts of the valley, repairing the disturbance of the agricultural land in the valley, recognizing the rights of First Nations people to their land, and leaving the biodiversity of these sites to repair itself would all be classed as “nothing” of value. Alas our government’s values are completely out of line with the needs of a sustainable earth ecosystem for all to enjoy.

What we are lacking, and governments of both stripes have no time for, is an analysis of what the alternatives are in terms of renewable energy generation. Alternative hypotheses should be useful in politics as they are in science. And they might even save money.

Ansar A, Flyvbjerg B, Budzier A, Lunn D (2014). Should we build more large dams? The actual costs of hydropower megaproject development. Energy Policy 69, 43-56. doi: 10.1016/j.enpol.2013.10.069

Cooper AR, et al. (2017). Assessment of dam effects on streams and fish assemblages of the conterminous USA. Science of The Total Environment 586, 879-89. doi: 10.1016/j.scitotenv.2017.02.067

DelSontro T, Perez KK, Sollberger S, Wehrli B (2016). Methane dynamics downstream of a temperate run-of-the-river reservoir. Limnology and Oceanography 61, S188-S203. doi: 10.1002/lno.10387


12 Publishing Mistakes to Avoid

Graduate students probably feel they are given too much advice on their career goals, but it might be useful to list a few of the mistakes I see often while reviewing papers submitted for publication. Think of it as a cheat sheet to go over before final submission of a paper.

  1. Abstract. Write this first and under the realization that 95% of readers will only read this part of your paper. They need in a concise fashion the whole story, particularly for any data paper WHAT, WHERE, WHEN, HOW and WHY.
  2. Graphics. Choose your graphics carefully. Show them to others to see if they get the point immediately. Label the axes carefully. ‘Population’ could mean population size, population density, population index, or something else. ‘Species diversity’ could mean anything from the vast array of species diversity measures.
  3. Precision. If you are plotting data, a single point on a graph is not very informative without some measure of statistical precision. Dot plots without a measure of precision are fraudulent. Indicate at least in the figure legend what exact measure of precision you have used.
  4. Colour and Symbol Shape. If you have 2 or more sets of data, use colour and different symbol shapes to distinguish them. Check that the size of symbols is adequate for the reductions they will use in the journal printing. Journals that charge for colour will often print in black and white for free but use the colour in the PDF version.
  5. Histograms. Use histograms freely in your papers by only after reading Cleveland (1994) who recommends never using histograms. More comments are given in my blog ” On Graphics in Ecological Presentations”.
  6. Scale of Graph. if you wish to cheat there are some simple ways of making your data look better. See Cleveland et al. (1986) for a scatter-plot example.
  7. Tables. Tables should be simple if possible. Columns of meaningless numbers do not help the reader understand your conclusions. Most people understand graphs very quickly but tables very slowly.
  8. Discussion. Be your own critic lest your reviewers do this job for you. If some published papers reach conclusions other than you have, discuss why this might be the case. Recognize that no one study is perfect. Indicate where future research might go.
  9. Literature Cited. Check that all your literature cited in the paper are in the bibliography and none are missed. Check the required format of the references since many editors go into orbit if you use the wrong format or fail to include the doi.
  10. Supplementary Material. Consider carefully what you put in supplementary material. Standards are changing and simple excel tables of mean values are often not enough to be useful for additional analysis.
  11. Covering Letter. A last minute but critical piece of the puzzle because you need to capture in a few sentences why the editor should have your paper reviewed or decide to send it right back to you as not of interest. Remember that editors are swamped with papers and rejection rates are often 60-90% at the first cut.
  12. Select the Right Journal. This is perhaps the hardest part. Not everything in ecology can be published in Science or Nature, and given the electronic world of the Web of Science, good work will be picked up in other journals. If you have millions, you can use the journals that you must pay to publish in, but I personally think this is capitalism gone amok. Romesburg (2016, 2017) presents critical data on the issue of commercial journals in science. Read these papers and put them on your Facebook site.


Cleveland, W.S., Diaconis, P. & McGill, R. (1982) Variables on scatterplots look more highly correlated when the scales are increased. Science, 216, 1138-1141. http://www.jstor.org/stable/1689316

Cleveland, W.S. (1994) The Elements of Graphing Data. AT&T Bell Laboratories, Murray Hill, New Jersey. ISBN: 9780963488411

Romesburg, H.C. (2016) How publishing in open access journals threatens science and what we can do about it. Journal of Wildlife Management, 80, 1145-1151. doi: 10.1002/jwmg.21111

Romesburg, H.C. (2017) How open access is crucial to the future of science: A reply. Journal of Wildlife Management, 81, 567-571. doi: 10.1002/jwmg.21244


On Mauna Loa and Long-Term Studies

If there is one important element missing in many of our current ecological paradigms it is long-term studies. This observation boils down to the lack of proper controls for our observations. If we do not know the background of our data sets, we lack critical perspective on how to interpret short-term studies. We should have learned this from paleoecologists whose many studies of plant pollen profiles and other time series from the geological record show that models of stability which occupy most of the superstructure of ecological theory are not very useful for understanding what is happening in the real world today.

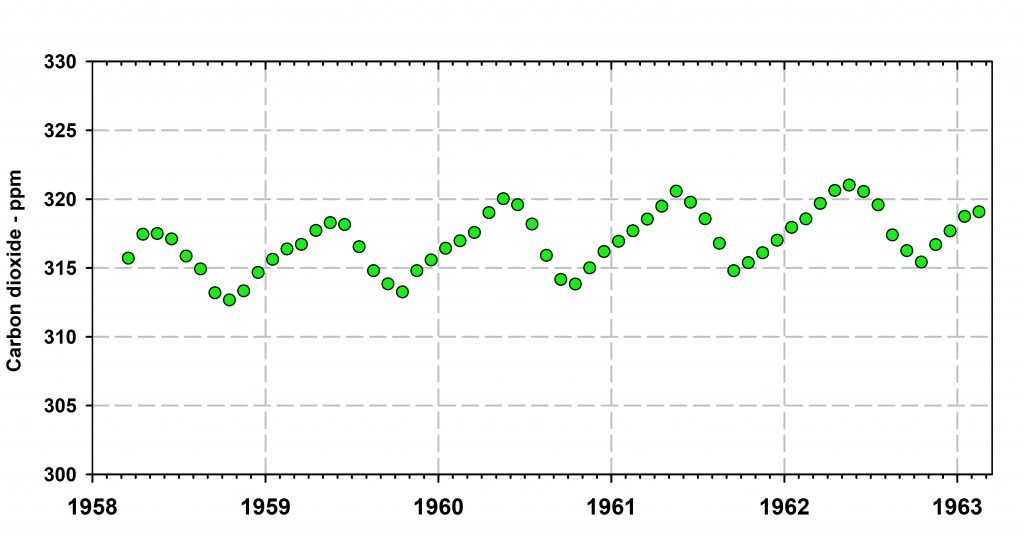
All of this got me wondering what it might have been like for Charles Keeling when he began to measure CO2 levels on Mauna Loa in Hawaii in 1958. Let us do a thought experiment and suggest that he was at that time a typical postgraduate students told by his professors to get his research done in 4 or at most 5 years and write his thesis. These would be the basic data he got if he was restricted to this framework:

Keeling would have had an interesting seasonal pattern of change that could be discussed and lead to the recommendation of having more CO2 monitoring stations around the world. And he might have thought that CO2 levels were increasing slightly but this trend would not be statistically significant, especially if he has been cut off after 4 years of work. In fact the US government closed the Mauna Loa observatory in 1964 to save money, but fortunately Keeling’s program was rescued after a few months of closure (Harris 2010).

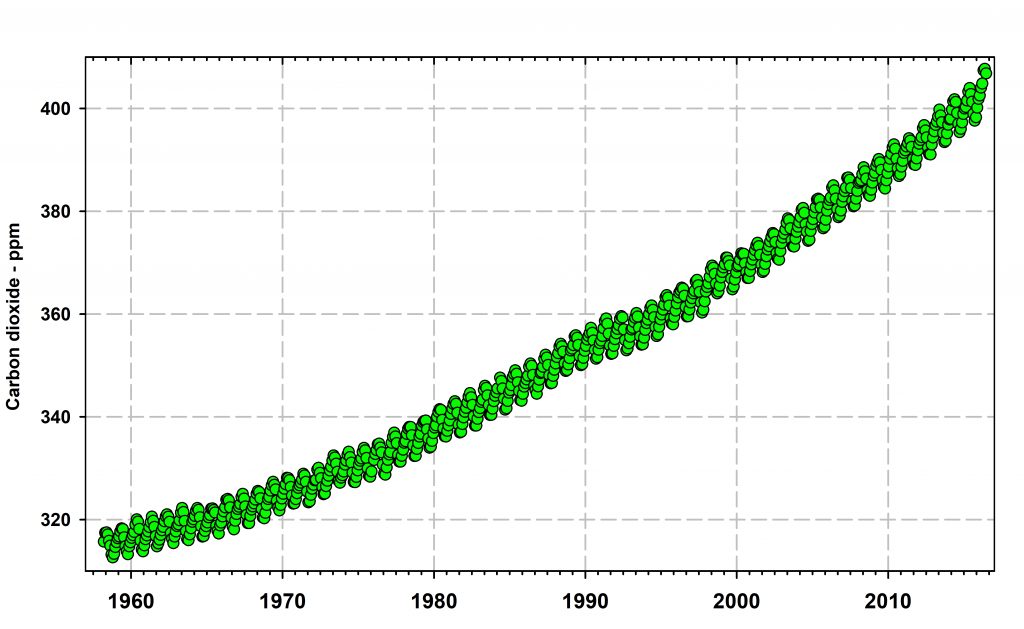
Charles Keeling could in fact be a “patron saint” for aspiring ecology graduate students. In 1957 as a postdoc he worked on developing the best way to measure CO2 in the air by the use of an infrared gas analyzer, and in 1958 he had one of these instruments installed at the top of Mauna Loa in Hawaii (3394 m, 11,135 ft) to measure pristine air. By that time he had 3 published papers (Marx et al. 2017). By 1970 at age 42 his publication list had increased to a total of 22 papers and an accumulated total of about 50 citations to his research papers. It was not until 1995 that his citation rate began to exceed 100 citations per year, and after 1995 at age 67 his citation rate increased very much. So, if we can do a thought experiment, in the modern era he could never even apply for a postdoctoral fellowship, much less a permanent job. Marx et al. (2017) have an interesting discussion of why Keeling was undercited and unappreciated for so long on what is now considered one of the world’s most critical environmental issues.

What is the message for mere mortals? For postgraduate students, do not judge the importance of your research by its citation rate. Worry about your measurement methods. Do not conclude too much from short-term studies. For professors, let your bright students loose with guidance but without being a dictator. For granting committees and appointment committees, do not be fooled into thinking that citation rates are a sure metric of excellence. For theoretical ecologists, be concerned about the precision and accuracy of the data you build models about. And for everyone, be aware that good science was carried out before the year 2000.

And CO2 levels yesterday were 407 ppm while Nero is still fiddling.

Harris, D.C. (2010) Charles David Keeling and the story of atmospheric CO2 measurements. Analytical Chemistry, 82, 7865-7870. doi: 10.1021/ac1001492

Marx, W., Haunschild, R., French, B. & Bornmann, L. (2017) Slow reception and under-citedness in climate change research: A case study of Charles David Keeling, discoverer of the risk of global warming. Scientometrics, 112, 1079-1092. doi: 10.1007/s11192-017-2405-z