![]()
![]() Excel 101 - Survival kit for Biology Students
Excel 101 - Survival kit for Biology Students
The links to these tutorials are
in the left column.
HOW TO USE THIS TUTORIAL.
· Browse through all of them (you may not need to do that if you know excel already - However, I give tips on how to really speed up things and this may be useful to you in the long run.)
· Look at the table of content and figure out which tutorial is most relevant to your present needs. Click on its number (Excel #) and browse through until you find what you need. If you want to do the graphs yourself, click on startup#.xlsx and do the graph from scratch.
· Highlighted in red: Very useful to know for Biol 363.
NOTES:
1.
This tutorial is a work in progress! Your comments & criticisms (positive &
negative will be most welcome); I still have to do some debugging and
polishing. If you see ![]() it means that it is not quite ready for
consumption yet. But feel free to poke around... If you don’t hear and/or don’t
see the video clips, let me know. Send me an e-mail and include 1) Computer (PC
or Mac), 2) the platform & browser and 3) the offending link.
it means that it is not quite ready for
consumption yet. But feel free to poke around... If you don’t hear and/or don’t
see the video clips, let me know. Send me an e-mail and include 1) Computer (PC
or Mac), 2) the platform & browser and 3) the offending link.
2. Each movie demo shown throughout these tutorials have been saved in 2 formats. Either you view them on You Tube (Click on the You Tube links) or on the Zoology server (Click on Movie MP4 HD links). This should ensure that no matter what your computers/software are you can view them easily. (YOU TUBE – if you want a better definition select 720p – How? Click on the little arrow right under the movie. The default choice is usually lower 240p or 360p bring it up to 720p).
3. If you want to practice on your own what you learn in the tutorials, You can download the start-up excel files (just click on their links that you will find in the column on the left).
4. These data are NOT “real data”. I have looked at papers and I used their data to make sets of my own. For example, there is no study out there comparing brain size of the Parisians, the Londoners and the Quebecer.
5. I made the movies at night when everything around me was quiet which means that I was sometime a bit sleepy and it shows (for example sometime I will say “highlight” instead of “select” -> Sorry, midnight brain muddle).
6. No Smileys were harmed or killed in the making of these tutorials. I didn't create them myself: I googgled & kidnapped them.
|
Tutorial # -
To access the link to the tutorial: Click
on Excel # in the cells below; - To get the Excel file used in each tutorial: Click
on startup#.xlsx in the cells below; |
Brief description of what you will
learn in each tutorial. |
|
|
Introduction |
1. TERMINOLOGY : - “Excel spreadsheet document" - “Ribbon”& “Spreadsheets” - “Columns & Rows” - “Cell”, “Cell identification” - “Formula bar" - "Range of cells" |
2. BRIEF INTRO - MAKING A TABLE - type and correct information in cells - insert and delete columns and rows - change column width and row height 3. HOW TO FIND THE TOOLS YOU NEED. 4. BRIEF INTRO - GRAPHS - How to insert a graph in your spreadsheet -
How to find tools to make/modify your graph! -
Terminology (Types of graphs; Chart and plot
areas; X&Y axis; Data series) |
|
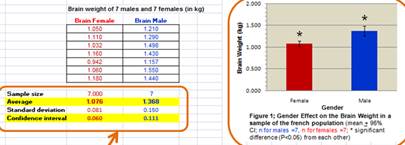
Simple table Statistical formula & Simple bar graph Download startup2.xlsx |
-
Format
cells (color & border); - Use the statistical formula to calculate average and confidence intervals for 1 set of data; - Use copy/paste to calculate average and confidence intervals of the 2nd set of data; -
Make a simple bar graph of the
means; - Put confidence intervals as error bars in the graph; - Format your graph (color etc...). |
Bigger brain? French females |
|
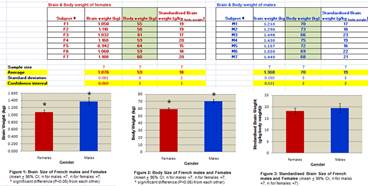
Arithmetic equations + time saving tips Download startup3.xlsx |
-
Use the arithmetic equation to make one
calculation and then use copy-paste
do the same calculation for all the
rest of your data -
More
formatting of cells (Learn how to wrap the text in a cell); -
Do NOT
make your new stat formulae from scratch. “Copy,
paste” your old one; - Make 2 extra graphs very quickly: do NOT make your new graphs from scratch. “Copy & paste” the old one twice & modify what needs to be changed. |
Standardise brain size by diving brain weight by the
body weight of subjects.
|
|
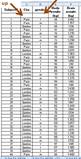
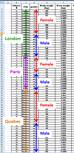
Big messy table: time saving tips (SORTING DATA & SPLITTING SPREADSHEET) Download startup4.xlsx |
-
Your data are all “mixed up”. Sort them into groups using the
“data sort” tool – DO NOT COPY/PASTE or MOVE ; -
Use splits so you can always see titles of columns and rows even if your table is big; -
Set the stat formulae from scratch ONLY ONCE and then
“Copy & paste” them as many time
as you need. See how to double-check their range & if needed modify their range. |
Let’s include the Brits and the Canucks in the table!
|
|
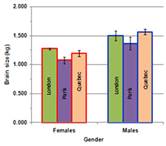
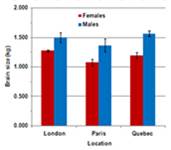
Bar graphs 2 & 3 data series Download startup5.xlsx |
- Hide the subjects’ rows so that you only see the values you will be plotting. - With the same values, make two different bar graphs: one with 2 series and 3 categories and the other with 3 series and 2 categories. |
Graph and Compare the French, the Brits and the
Canucks.
|
|
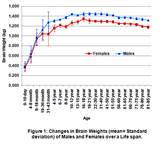
Line Graph 2 & 4 data series Two Y axis in a graph Download startup6.xlsx |
Anatole Dekaban sent you his data
set. NOT the individual values for each of his subjects but N, Average, STDEV
for all his categories. -
Make a line graph with
2 series - Make a line graph with 4 series and 2 Y axis |
Age and brain size?
|
|
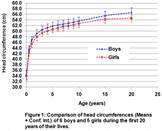
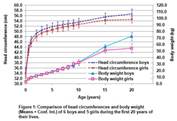
XY (Scatter) Graph 2 data series Two Y axis in a graph Download startup7.xlsx |
11 weird & competitive mothers measure the body weight and head circumference of their kid. They send you the data they collected.
- Make a XY (Scatter) graph with 2 series - Make a XY (Scatter) with 4 series and 2 Y axis |
Head circumference and Age in Children:
|
|
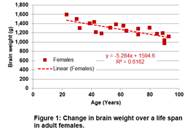
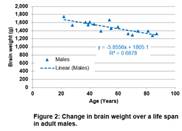
XY (Scatter) Graph and linear regression Download startup8.xlsx |
Sad
to say it, but adults loose brain mass as they age.
Use linear regression to calculate the rate of brain loss. - Make a XY (Scatter) graph -
Draw a linear trendline -
Get the linear equation. |
Age and brain size again.
|