P. 2: "Karposi's sarcoma" should be "Kaposi's sarcoma"
P. 5: "Karposi's sarcoma" should be "Kaposi's sarcoma"
P. 13: Figure 1.7, , in panel a, the text on top of the highest curve should say "...with HIV (= prevalence, Pa,1998)" ("P" not "i")
P. 148: Parts (b)-(d) of question 4.11 should be corrected as:
(b) Determine the two null clines along which the number of infected individuals,
I, would remain constant.
(c) Add curves for all three of these null clines to the figure, ...
(d) Add two dots to the figure where both variables remain
constant (the two possible equilibria).
P. 164 (right before equation 5.12): "Recipe P1.4" should read "Recipe P1.2".
P. 166 (legend for fig 5.3): "p(t+1) = f(p(t+1))" should read "p(t+1) = f(p(t))"
P. 178 (four lines after equation 5.1.3): "Using this result in the second term..." The derivative that follows should be the first derivative, not a double derivative.
P. 179 (two lines after equation 5.26): "[Use Rules A2.6 and A2.11 to take the derivative of (5.25)..." should read "[Use Rules A2.6 and A2.12 to take the derivative of (5.25)..."
P. 185: Equation (a) in problem (5.1) should have an n(t) added to the right-hand side and should read n(t+1) = n(t) + λ n(t) (1-(n(t)/K)θ).
P. 211, first line: n0 = 1 should read n = 1
P. 275, second to last line: "the genetic covariance between mail tail length" should read "the genetic covariance between male tail length"
P. 277: "on both male tail length sexual and" should read "on both male tail length and"
P. 288, eight lines from bottom: "e.g., if B(t) = 0" should read "e.g., if G(t) = 0".
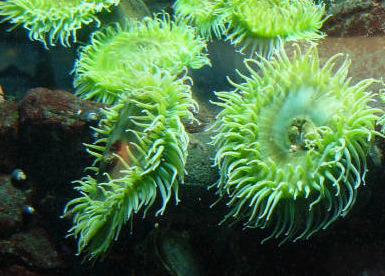
P. 290, Problem 7.1: Assume that all anemones remain alive and that no new ones are born over the time scale of the model.
P. 290, Problem 7.2: "Furthermore, suppose that ... pj." should read "Furthermore, suppose that juveniles survive one time step to become adults with probability pj and that they die with probability 1-pj."
P. 290, Problem 7.3: Hint: Consider Rule P2.25.
P. 291, Problem 7.5: The second differential equation (for dp/dt) should not have a ^ over the Gp term. Hint: Consider Rule P2.25.
P. 301: Five lines up from the bottom should say "matrix (8.10)" not "matrix (8.10b)"
P. 304: Horizontal axis on graph (b) should say y
P. 305, eqn 8.15b: Subscript on second epsilon should be I
P. 305, eqn 8.16a: The last partial derivative should be taken with respect to the function f, not the function g.
P. 317, eqn 8.34a: A partial derivative symbol (∂) is missing in front of the x2 in the denominator.
P. 336, eqn 8.49: The term multiplying λ1 should read r + h s - r h s not r + s - r h s.
P. 336, eqn 8.50: The denominator should read r + h s - r h s not r + s - r h s.
P. 374, line 2 from the bottom: "...however, the equilibrium population size would be zero according to (9.39); to obtain a nonzero population size,..." should say "...however, the population size would also remain constant if we ignored terms of order epsilon in (9.39); to predict how the population size changes, ..."
P. 383, in problem 9.2: There are two (d) parts to this question, so the parts should be renumbered from (a) to (j).
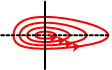
P. 398: The dotted line is missing; it lies just below the short-dashed curve (see corrected version).
P. 407, below equation (10.18c): λ3 should read λ3 = -0.3 - 0.3 i
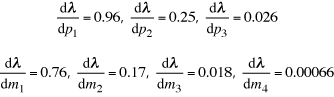
P. 411: The numbers in Table 10.1 are wrong. The corrected entries are:
In the text, "Table 10.1 presents these results, illustrating that an increase in the survival probability from age 3 to age 4 (i.e., p3) has the greatest impact on the population growth rate. Even so, increasing p3 by 1% is expected to lead to only a 0.31% increase in the growth rate of the population." should say "Table 10.1 presents these results, illustrating that an increase in the survival probability from age 1 to age 2 (i.e., p1) has the greatest impact on the population growth rate. Even so, increasing p1 by 1% is expected to lead to slightly less than a 1% increase in the growth rate of the population."
P. 446: The intermediate step in the equation for rB(p) in Table 11.1 should read p (1-sh-ch) + (1 - p) (1-ch). The final result is correct.
P. 473: On the third line, for the bell-shaped function, the parenthetical term in the exponent should be squared: exp(-(sm-s)2/aα).
P. 482: The first two terms in the second line of (12.30d) should be multiplied by dβ/dv evaluated at v=v* (12.30e is correct).
P. 511: Delete "cannot" from this phrase in problem 12.18: "there is no function, f, allowing us to cannot rewrite"
P. 550: In Figure P3.14, the curves are labeled incorrectly, with s2 = 0.25 and s2 = 4 being reversed. The more bell-shaped curve should say s2 = 0.25.
P. 558: The mean and variance of the log-normal distribution are incorrectly reported in Table P3.3. The correct formulae are given by equations (P3.31) and (P3.32) on p. 551.
P. 573: The second to last line should read ''we would draw a random number from an exponential distribution with parameter'' (not with mean)
P. 612: The line before equation (14.7) should read ''Having started in state i, we can write
the probability of eventually being absorbed in state j as'' (i and j are reversed)
P. 632: The first equation (14.53) should be (14.52).
P. 634: The middle line of equation 14.1.1 should read ''ρa,2 = d2 ρa,1 + (1-b2-d2) ρa,2 + b2 ρa,3''.
P. 635: In equation 14.1.7, the upper limits of the sum should read ''i-1'' not ''i=1''
P. 636: Problem 14.4(c) should read ''(c) What are your answers to part (b) when the extinction rate is the same for both early and late successional forests (e2 = e3 = e)?''
P. 652: Above (15.6), change ''Specifically, diffusion models assume that'' to ''Specifically, diffusion models assume that the parameters u and d can be scaled such that", and below (15.6), change ''where μ and σ2 are finite numbers (with σ2 > 0).'' to "where μ and σ2 are finite numbers (but μ may be zero). For example, in this migration model, we can obtain a diffusion if we assume that difference between u and d shrinks as the spatial scale shrinks such that (u-d) is of order Δx, but both u and d themselves remain relatively large (bounded away from zero).''
P. 669: In equation (15.23), the ax should be ak, and the + sign before c2 should not be superscripted.
P. 670: Note after (15.24): it is interesting that the stationary distribution does not depend on the mutation rate (μ) or the mutational effect size (ν), only on the strength of competition and the population size.
P. 671: Note for Box 15.3: the Wright-Fisher model described here represents the ''idealized'' case where the population size is constant and parents are randomly chosen to give birth. This is the standard comparison against which more biologically realistic population dynamics are compared, through the introduction of the concept of an ''effective poulation size'', Ne. For non-ideal populations, Ne is chosen (where possible) such that the extent of random fluctuations in allele frequency would be the same as that in the idealized model (as given by σ2).
P. 690: The book suggested by Lande et al. (2003) is missing the middle author, S. Engen (apologies!).
P. 704: The sixth line from the bottom should read "that g'(a) is not zero" rather than "that g(a) is not zero".
P. 713: After equation (A4.3), it should be noted that "If d2W/dz2|z=z* = 0, higher-order terms must be examined to determine whether z* is a maximum."
Please let us know of any other errors that you notice. Thanks! (Email Sarah Otto).
Additional typos in first printing:
(
Show
Hide)
Copyright page contains several errors (pages missing etc.). Most importantly, there is no mention of the cover art. The striking photos were taken by Colin Bates, whose artwork can be seen at http://www.coastalimageworks.com.
P. 38: "In contrast, the recursion equation (2.1) also has n(t) on the right-hand side" should say "In contrast, the recursion equation (2.3a) also has n(t) on the right-hand side"
P. 53: "naked mole rate colony" should read "naked mole rat colony"
P. 59, line 2: "there would be 8x3i" -> "there would be 8x3i"
P. 71: "alpha" above (3.13b) should be "a"
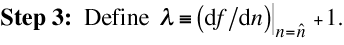
P. 169: The negative sign should be positive in Step 3 (Case B) of Recipe 5.3:
P. 196: Above equation (6.6b), the p(t) = (d(t)-1)/2 should be p(t) = (d(t)+1)/2 (error made twice in the text).
P. 258: In the legend to Figure 7.1.1, the second to last sentence should read "One eigenvector has an associated eigenvalue that is negative (implying exponential decay toward the origin, and one eigenvector has an associated eigenvalue that is positive (implying exponential growth away from the origin) (solid lines)."
P. 317, eqn 8.34a: Second '=' should be '+' and a partial derivative symbol (∂) is missing in front of the x2 in the denominator.
P. 360: "equations (9.6.8)" in the legend to Figure 9.3.1 should say should say "equations (9.3.8)".
P. 376: Figure 8.8 should say Figure 8.7.
P. 401: At the bottom of the page, (10.14) should read (10.13).
P. 401: "if all that we want is to know is the effect of" should read "if all that we want to know is the effect of"