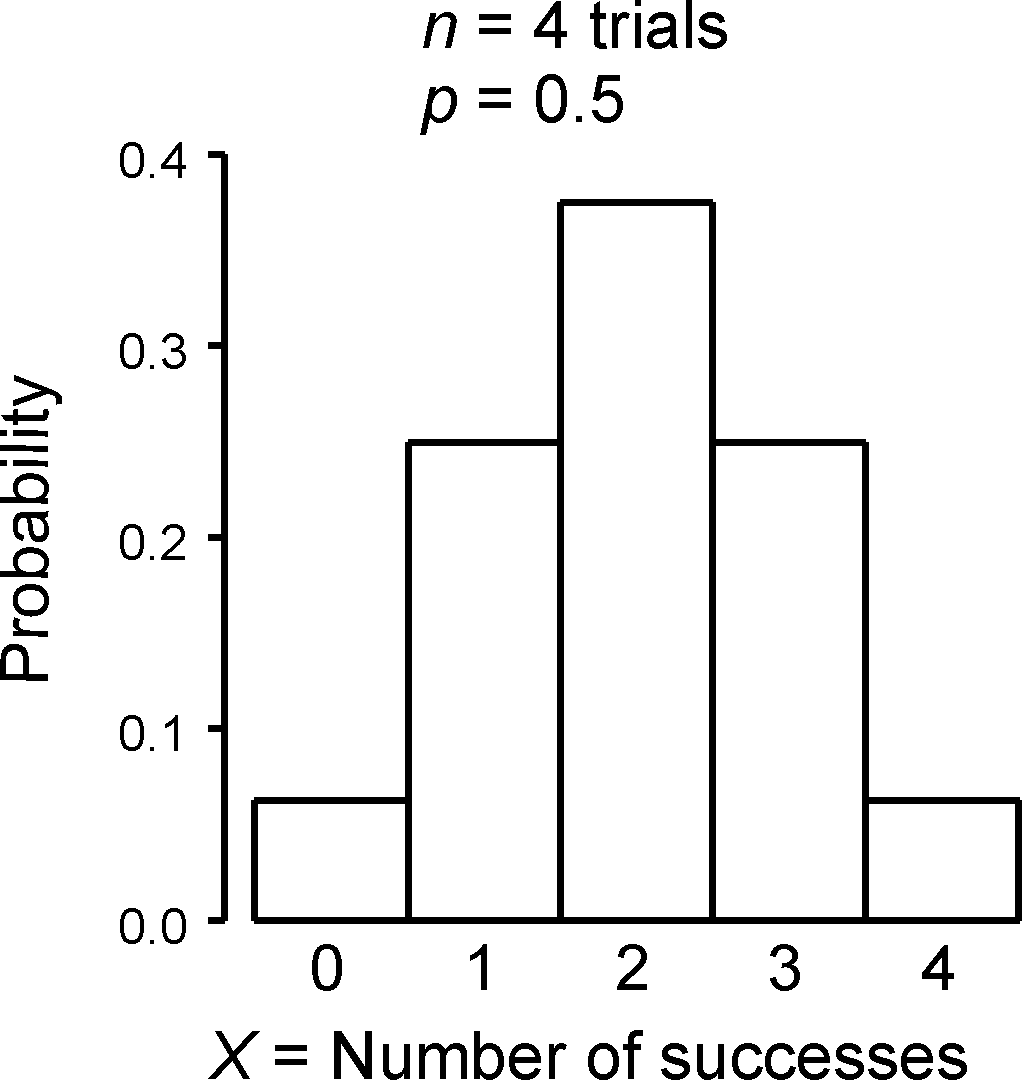

The binomial distribution is used many times and for many purposes in the first half of this course. This note may help you organize your studying for the exam, and perhaps lessen a bit of the confusion.
Uses of the binomial distribution:
1) Simple probability calculations.
If n independent trials are carried out (e.g., if you have n = 5 children), and the probability of success in each trial is p (e.g., the chance that each child is a daughter is p = 0.5) , then what is Prob(X=x) (e.g., what is the probability of having at least 3 daughters)? Your straightforward formula helps here.
Note: Use the normal approximation to the binomial (with the continuity correction) when n is large.
2) Binomial test.
This is an exact substitute for a goodness of fit test involving two categories, and has the same assumptions (independent observations or trials). It is used to test hypotheses such as HO: p = 0.5 vs HA: p != 0.5. Computing P = Prob(a result at least as extreme as that observed under HO) is now just a probability calculation as in (1) above.
3) Estimating a binomial proportion.
This involves a random sample of size n (i.e., n independent trials) from a population, and our goal is to estimate p. For example, we might want to estimate p = the fraction of individuals in a population that have AIDS. If we find X individuals with the disease in our random sample, then our best estimate for p is X/n. In such cases it is often a good idea to compute also the standard error for your estimate (see your lecture notes). If n is reasonably large, you could also compute a 95% confidence interval for p (this involves the normal approximation; see your notes).
4) Is the distribution binomial?
This last application is probably the most difficult, but potentially the most interesting biologically. Let's say we are studying a species of insect, and have been investigating its peculiar family structure: most families seem to be made up of mainly sons or mainly daughters. For example, in a random sample of 20 families of n=5 offspring each, 8 had 0 sons, 1 had 2 sons, no families had 3-4 sons, and 11 had exactly 5 sons. The pattern is strange because we would usually expect the number of offspring of a given sex in families of size n to follow a binomial distribution (do you know why?). A first step in describing this pattern would then involve a goodness of fit test to the binomial distribution.